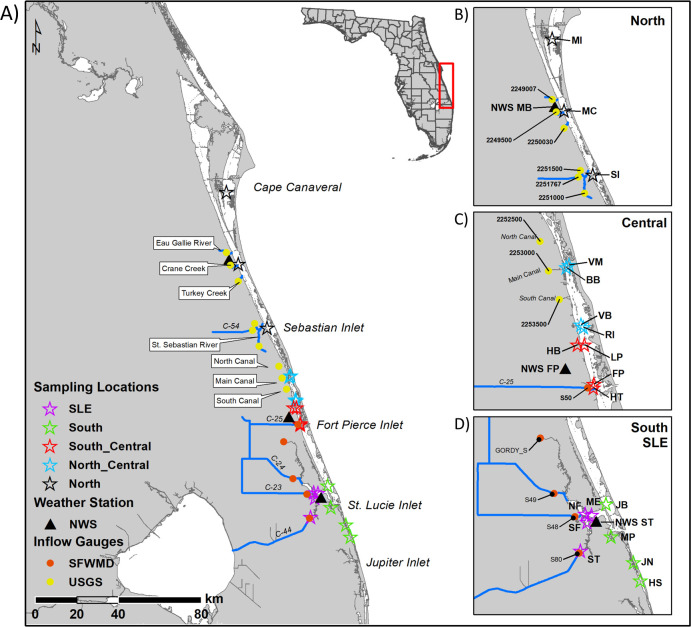
Fig 1. Sampling area map.
The sampling area with stars indicating the site locations, triangles the location of the National Weather Service (NWS) [30] monitoring stations in Melbourne (MB), Fort Pierce (FP), and Stuart (ST), and circles the inflow gauge locations [United States Geological Service (USGS) [32] in yellow and the South Florida Water Management District (SFWMD) [31] in red]; the streams or canals associated with these gauges are denoted by blue lines. In Maps A and B black stars are the North Indian River Lagoon (IRL) sites: Merritt Island Causeway (MI), Melbourne Causeway (MC) and the Sebastian Inlet (SI). Blue stars (maps A and C) are the North Central IRL sites: Vero Beach Marina (VM), Barber Bridge (BB), Vero Beach (VB), and Round Island (RI). Red stars (maps A and C) are the South Central IRL sites: Harbor Branch Channel (HB), Linkport (LP), Fort Pierce (FP), and Harbortown Marina (HM). Green stars (maps A and D) are the South IRL sites: Jensen Beach (JB), Manatee Pocket (MP), Jupiter Narrows (JN) and Hobe Sound (HS). Maroon stars (maps A and D) are the St. Lucie Estuary (SLE) sites: North Fork (NF), South Fork (SF), Middle Estuary (ME), and South Fork 2 (ST). This map was created by using a map image from the publicly available Florida Fish and Wildlife Conservation Commission using ArcGIS [33]. GPS coordinates for all study sites and environmental monitoring stations are located in S1 Table.

