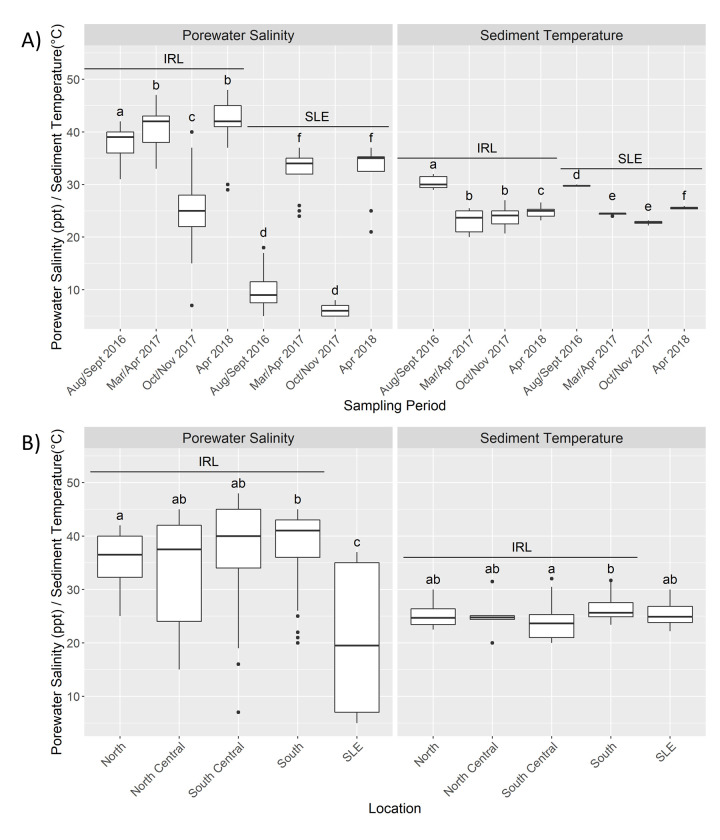
Fig 2. Porewater salinity and sediment temperature patterns.
Porewater salinity (PWS) (left) and sediment temperature (right) by Estuary by Sampling Period (A) and by Location (B) for the Indian River Lagoon (IRL) and St. Lucie Estuary (SLE). Bars denote largest and smallest values within 1.5*the interquartile range, middle line is the median, ends of boxes are the first and third quartiles. The letters on top of each boxplot denote the results from the pairwise Dunn test with different letters denoting statistical significance (Benjamini-Hochberg adjusted p values < 0.05). In A the letters show how each of the sampling periods were different within each estuary but do not denote inter-estuary comparisons.

