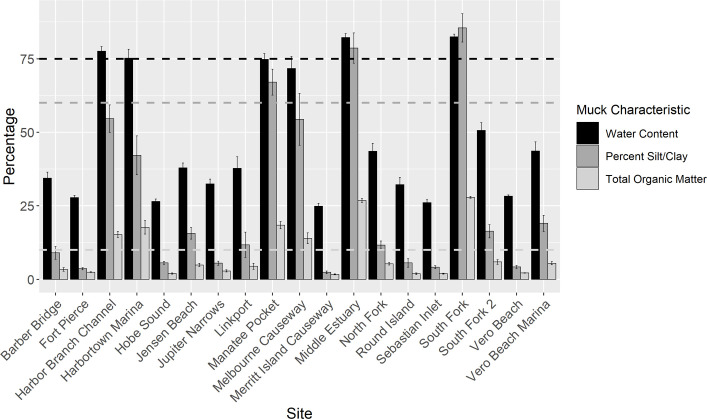
Fig 3. Muck characteristics by site.
Bar graph, with error bars denoting standard error, summarizing the average muck characteristics associated with each site. Black bars represent water content. The black dotted line denotes the percentage water content (75% [8]) that a site, if it exceeded all three thresholds, could be considered muck. Percent silt/clay is represented by the dark gray bars with the dark gray dotted line representing the 60% [8] threshold. Total organic matter is represented by the light gray bars with the light gray dotted line representing the 10% [8] threshold.

