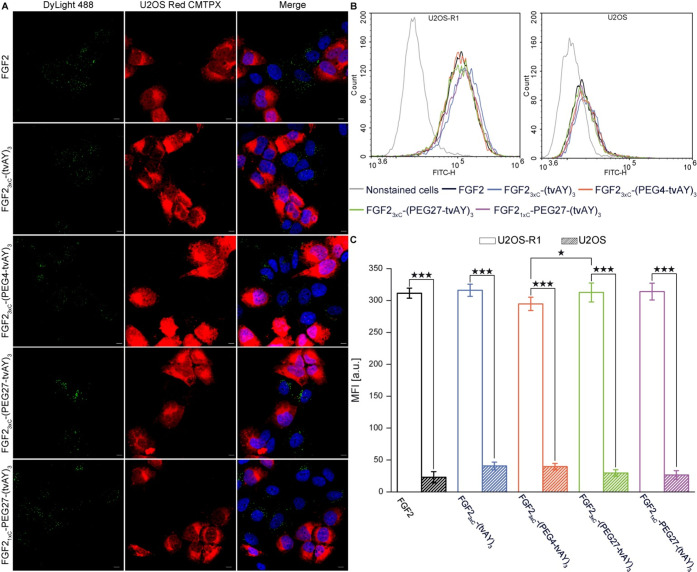
Figure 5.
Internalization of fluorescence-labeled FGF2 and FGF2 conjugates into U2OS cells expressing FGFR1. (A) Fluorescence microscopy analysis of the uptake of labeled FGF2 and FGF2 conjugates. Equal numbers of U2OS cells prestained with CellTracker Red CMTPX (red) and U2OS-R1 (nonstained) were seeded and then incubated with 500 ng/mL of FGF2 or the conjugates labeled with DyLight488 (green) for 40 min on ice, and then moved to 37 °C for 35 min to allow for internalization. Next, the cells were fixed, stained with DAPI (blue), and analyzed by confocal microscopy. The scale bars correspond to 10 μm. (B) Flow cytometry analysis of internalization efficiency into U2OS-R1 (FGFR1-positive) and U2OS (FGFR1-negative) cell lines. The cells were incubated on ice with 500 ng/mL of FGF2 and FGF2 conjugates labeled with DyLight488 for 40 min. Then cells were moved to 37 °C for 35 min and subsequently analyzed by flow cytometry. (C) Quantitative analysis of internalization. The data shown are mean fluorescence intensities (MFI) from three independent experiments ± SD. Statistical significance: * p < 0.05, ** p < 0.01, *** p < 0.001.

