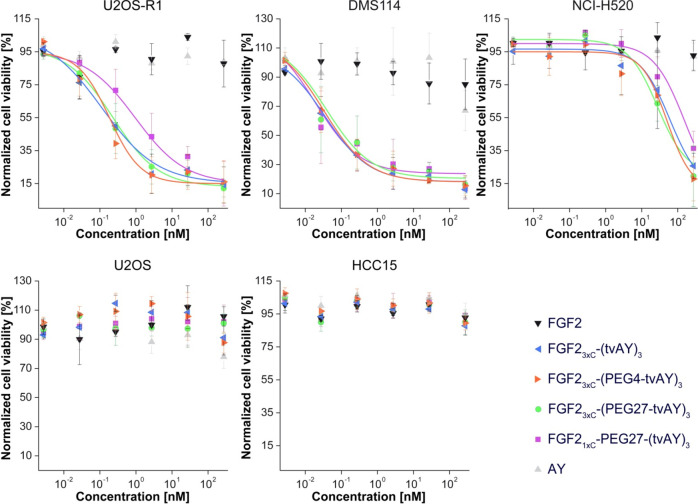
Figure 7.
Viability of cells treated with the FGF2, FGF2 conjugates, and free AY. FGFR1-positive (U2OS-R1, DMS114, NCI-H520) and FGFR1-negative (U2OS and HCC15) cell lines were treated with indicated agents at six concentrations for 96 h. Then the viability of the cells was assessed using the alamarBlue reagent. Data shown are mean values from three experiments ± SD. The solid lines represent the Hill equation fits.

