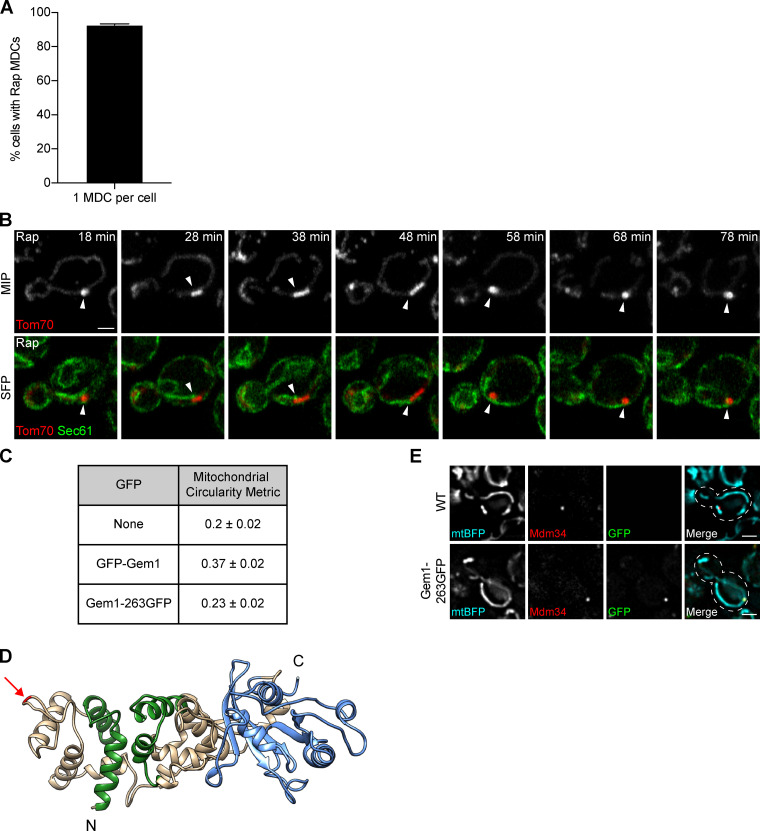
Figure S1.
MDCs stably associate with the ER (related to Fig. 2). (A) Percentage of MDC-positive cells with a single large MDC per cell upon treatment with rapamycin. Error bar shows mean ± SEM of three replicates, n = 50 cells with at least one MDC per replicate. (B) Superresolution time-lapse images of yeast expressing Tom70-mCherry and Sec61-GFP treated with rapamycin. Arrowheads mark Sec61 associated with MDCs. Images show maximum intensity projections (MIP) and single focal planes (SFP). Scale bar = 2 µm. (C) Gem1 fusion protein functionality was assessed by quantifying the shape of segmented mitochondria using the circularity metric (4π × area/perimeter2, where 1 is a perfect circle) described in Materials and methods. WT (none) mitochondria have a circularity of 0.2 ± 0.02 (mean ± SEM), and mitochondria of yeast expressing N-terminally tagged Gem1 (GFP-Gem1) rose to 0.37 ± 0.02. Mitochondria of yeast expressing internally tagged Gem1 (Gem1-263GFP) had a circularity of 0.23 ± 0.02, indicating near-WT shape and functionality of the fusion protein. (D) 3D model of Gem1. Green marks EF hands and blue marks the C-terminal GTPase domain (N-terminal GTPase domain not shown). Arrow marks the insertion site of GFP after amino acid 262 (Gem1-263GFP). Model displays up to amino acid 614 (full-length Gem1 is 662 amino acids). Homology modeling of Gem1 was performed using the SWISS-MODEL server (Waterhouse et al., 2018) and Miro structure (PDB accession no. 5KSZ; Klosowiak et al., 2016) as a template. 3D protein structures were rendered using UCSF Chimera (Pettersen et al., 2004). (E) Widefield images of yeast expressing no GFP (WT) or GFP inserted after amino acid 262 of Gem1 (Gem1-263GFP). Both strains express mitochondrial matrix-targeted BFP (mtBFP) and Mdm34-mCherry. Mitochondria of yeast expressing Gem1-263GFP display WT-like shape. Images show single focal planes. Scale bars = 2 µm. Rap, rapamycin.

