
Figure 5.
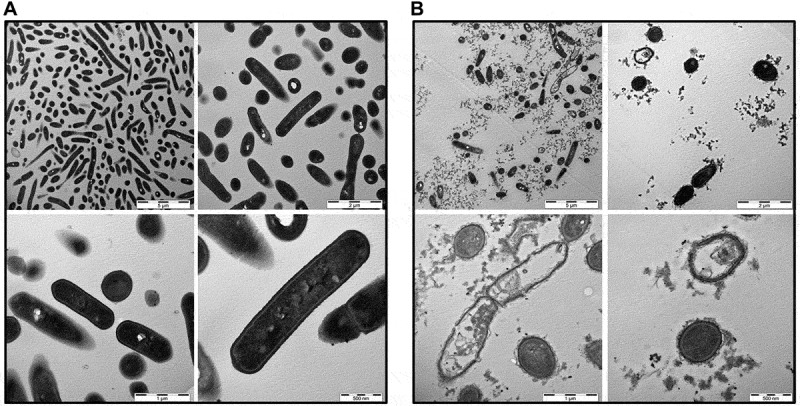
TEM pictures of L. monocytogenes. Bacterial cells were either mock-treated with H2O (a) or treated with 1 mg/ml B2M for 15 min (b) followed by fixation. Ultra-thin sections (80 nm) were imaged in a Zeiss TEM 109 or in a Jeol TEM 1400. Scale bars are 5 µm for upper left, 2 µm for upper right, 1 µm for lower left and 500 nm for lower right pictures