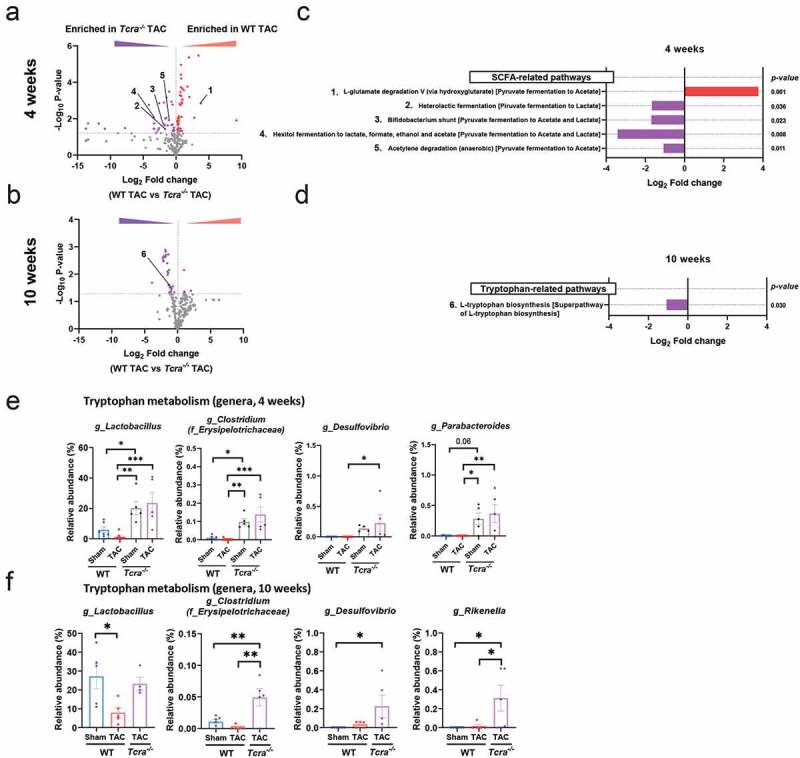
Figure 5.

Changes in SCFA and tryptophan associated metabolic pathways are induced by TAC over time, and dependent of T cell presence. Volcano plots showing the degree of differential expression of bacterial metabolic pathways in WT and Tcra−/- mice at 4 weeks (a) and 10 weeks (b) post-TAC. Specifically, numbered SCFA-enriched pathways and tryptophan-related pathways represented in A and B are described (c, d). Red: enriched pathways in WT TAC vs Tcra−/- TAC; Purple: enriched pathways in Tcra−/- TAC vs WT TAC gut microbiota. Relative abundances of genera which can metabolize tryptophan that significantly changed at 4 weeks post Sham or TAC in WT and Tcra−/- mice (e) and 10 weeks (f) post-TAC are shown. For statistical analysis, we used Welch´s t test (a-d) and parametric ANOVA test (e, f). The dotted horizontal line in A and B represents the 0.05 p-value cutoff. *p < .05; **p < .01; ***p < .001; ns: not significant. g_(genus), f_(family)
