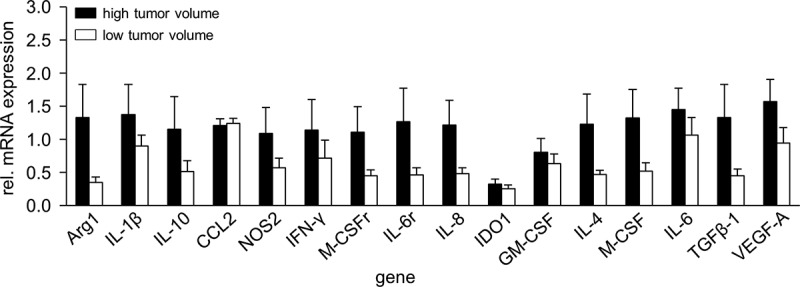
Figure 6.

Comparison of gene expression in high- and low volume tumors. To show impact of a tumor volume on mRNA gene expression, samples from tumors showing high- (>600 mm3, black columns) and low volumes (<500 mm3, white columns) were analyzed with RT-PCR analysis. Expression levels of mRNA were determined relative to the internal control GAPDH. Data are shown as mean of relative mRNA expression from at least three independent experiments
