
Figure 2.
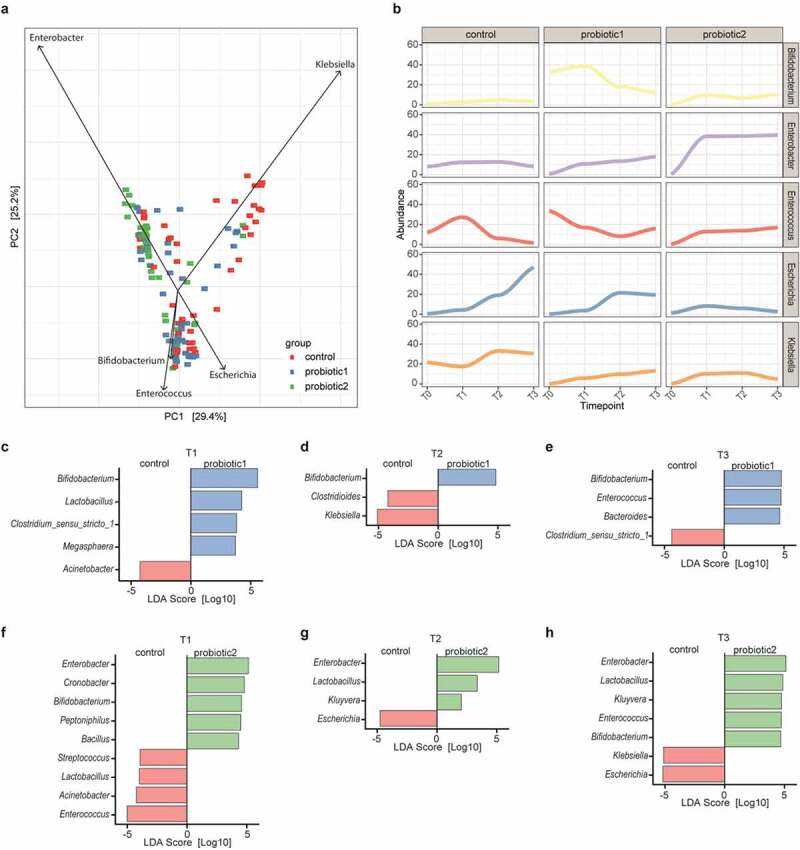
Association of probiotic administration with specific taxa. (a) Principal Component Analysis (PCA) illustrating the separation between the control and probiotic groups at T1-T3. Vectors depict the five genera that explained most of the variation in microbial community structure (b) Relative abundances of the five genera over time for the three different groups. (c) Linear discriminant analyses with Effect Size (LEfSe) were employed to identify differentially abundant bacterial genera between probiotic 1 supplemented and control neonates at T1, (d) at T2, (e) and at T3. (f) LefSe between probiotic 2 supplemented and control neonates at T1, (g) at T2, (h) and at T3 (LDA-score >0.2 and p < 0.05, Wilcoxon signed-rank test)