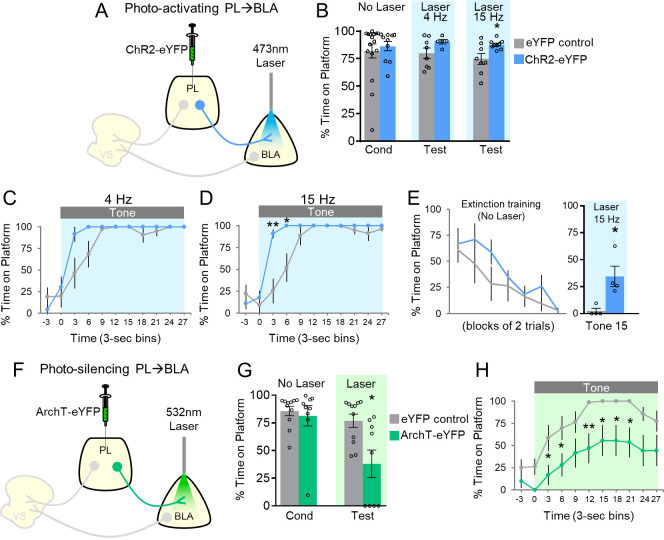
Figure 2. Avoidance requires activation of PL projections to BLA.
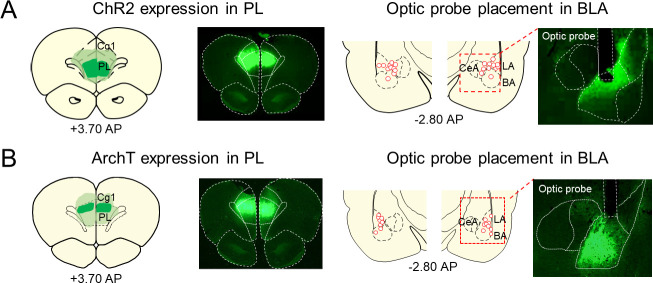
(A) Schematic of ChR2 virus infusion and optic probe placement. (B) Percent time on platform during the last day of avoidance conditioning (Cond; No Laser), and 4 Hz and 15 Hz Tests (with Laser). (C) Timecourse of avoidance during the 4 Hz Test (ChR2 n = 5, eYFP n = 8). (D) Same as in panel B with 15 Hz Laser (ChR2 n = 9, eYFP n = 8). (E) Photoactivation of PL-BLA projections (15 Hz) reinstates avoidance following extinction (ChR2 n = 4, eYFP n = 4). (F) Schematic of ArchT virus infusion and optic probe placement. (G) Percent time on platform during the last day of avoidance conditioning (Cond; No Laser), and Test (Tone with Laser). (H) Timecourse of avoidance during Test revealed that ArchT (n = 9) rats showed delayed avoidance compared to eYFP (n = 11) controls (repeated-measures ANOVA, post-hoc Tukey). All data are shown as mean ± SEM. *p<0.05, **p<0.01.


