. 2020 Sep 24;9:e62514. doi: 10.7554/eLife.62514

Figure 5. The actin-binding interfaces of metavinculin and α-catenin.

(A) Overlay of the metavinculin ABD-actin complex and α-catenin ABD-actin complex atomic models highlighting C-terminal extensions (CTEs) of metavinculin ABD and α-catenin ABD, superimposed on Actin I and colored as in Figure 4. Actins from α-catenin structure are displayed. (B and C) Detailed views of key contacts at minor interfaces: metavinculin CTE and actin (B); within the α-catenin tryptophan latch (right) and between its CTE and actin (left) (C). (D) Overlay of the metavinculin ABD-actin complex and α-catenin ABD-actin complex atomic models highlighting helical binding interfaces of metavinculin ABD and α-catenin ABD, superimposed and colored as in (A). Actins from α-catenin structure are displayed. (E, F, and G) Detailed views of key contacts at the major interface between metavinculin/α-catenin helices H4–H5 and Actin I (E); Actin II (F); Actin II D-loop (G). (H) Actin Cα traces colored by per-residue RMSD from the indicated comparisons. For superposition, segmented actin density from the cryo-EM maps was first aligned, followed by fitting the atomic models into their corresponding maps.

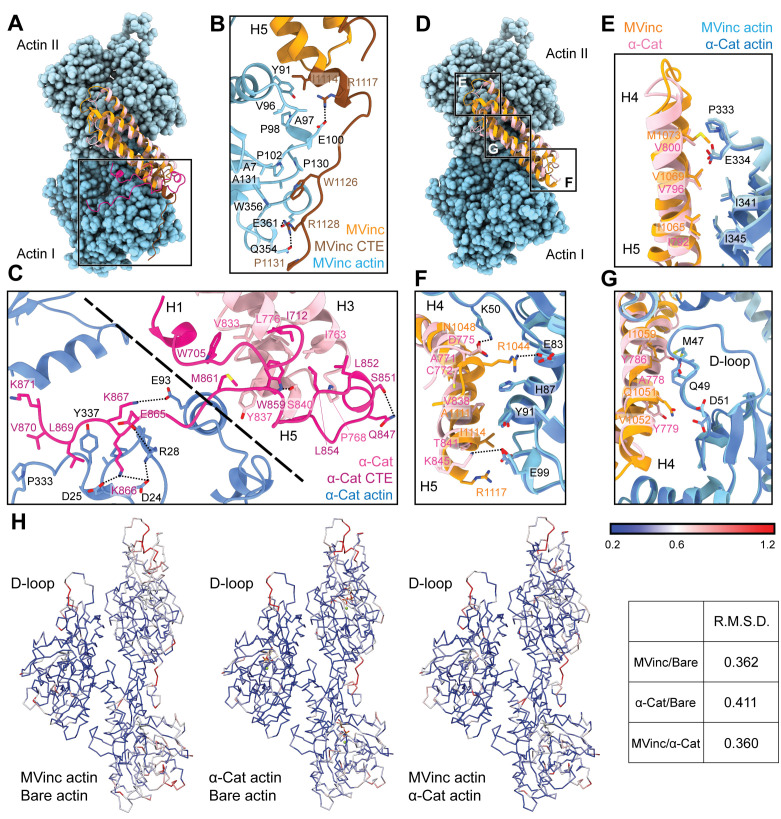
Figure 5.

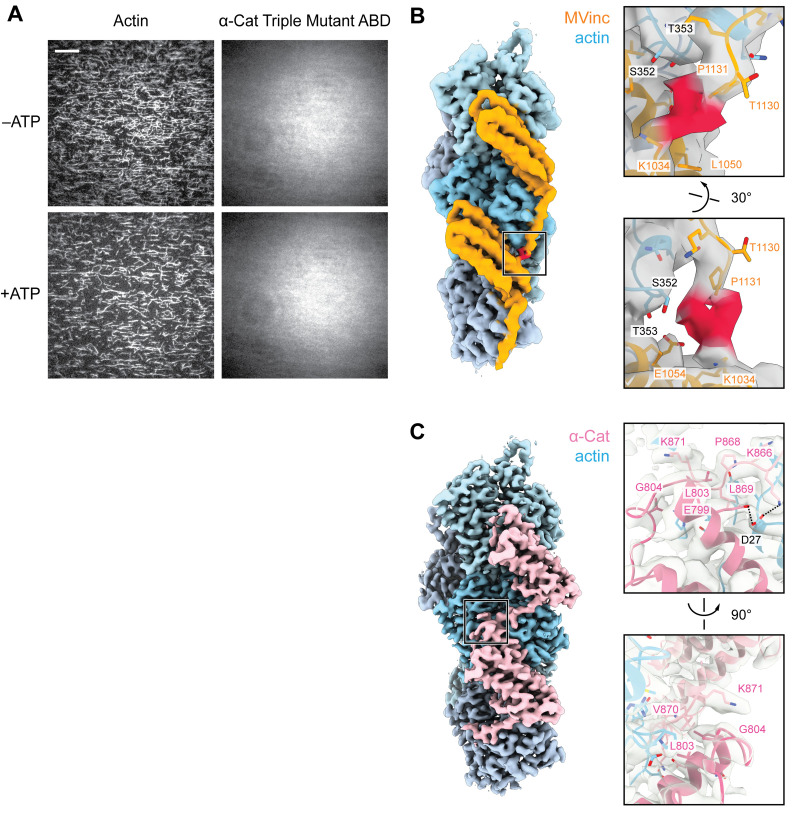
Figure 5—figure supplement 1. TIRF assays for the α-catenin ABD triple mutant which does not bind actin, and putative ABD-ABD contacts along F-actin.

Figure 5—figure supplement 1.

(A) Representative TIRF-assay movie frames of actin (left) and α-catenin ABD ‘triple mutant’ (α-cat ABD-tm) (right) channels in the absence (top) and presence (bottom) of ATP to activate motors. As the ABD did not visibly associate with F-actin in either condition, these data were not quantified. Scale bar, 20 μm. Concentration of triple mutant ABD: 2 μM. (B and C) Views of potential contacts between longitudinally-adjacent actin-bound ABDs mediated by CTEs for metavinculin (B) and α-catenin (C). Left: Segmented density maps highlighting contact regions (boxes). Right: Detailed view of putative contacts, with the density map shown in gray transparent representation. The distal end of the metavinculin CTE (residues W1132, Y1133, Q1134), which is positioned to mediate inter-ABD contacts, was not modeled due to weak density (red).
Figure 5—video 1. Detailed views of distinct conformational changes in CTEs.
Download video file (281.5KB, mp4)
Linear interpolation morph of pre-bound to post-bound structures of the (meta)vinculin ABD (left) and α-catenin ABD (right), focusing on distinct re-arrangements in their CTEs in the vicinity of key tryptophans. Colors and views are equivalent to Figure 5A–C; superpositions as in Figure 4. For metavinculin, E1110, S1113, and W1126 are displayed, corresponding to E1042, S1045, and W1058 in vinculin. For α-catenin, Y837, S840, and W859 are displayed.