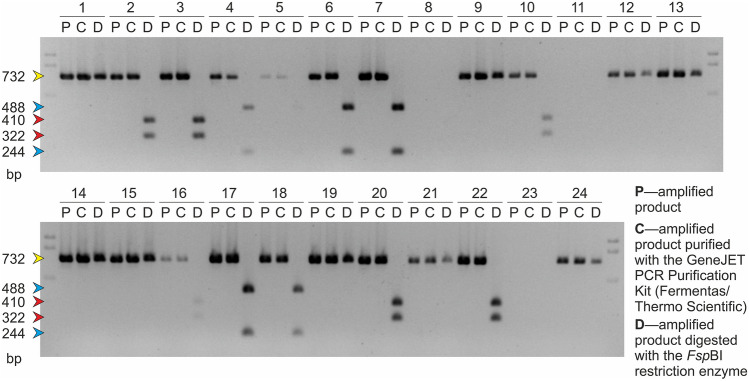
Fig. 2.
The results of the analyses performed using the CAPS marker specific for the mutations in the BnaA.FAD2 gene of rapeseed for the basic set of 24 rapeseed lines (see Materials and Methods for the description of each line). The arrows indicate the DNA fragments observed on the agarose gel, and their colors correspond to the colors used for the display of each mutation shown in Fig. 1. For each analyzed plant, three samples (designated with P, C, and D letters, which are explained in the figure) representing three steps of the CAPS protocol were applied on the gel (color figure online)

