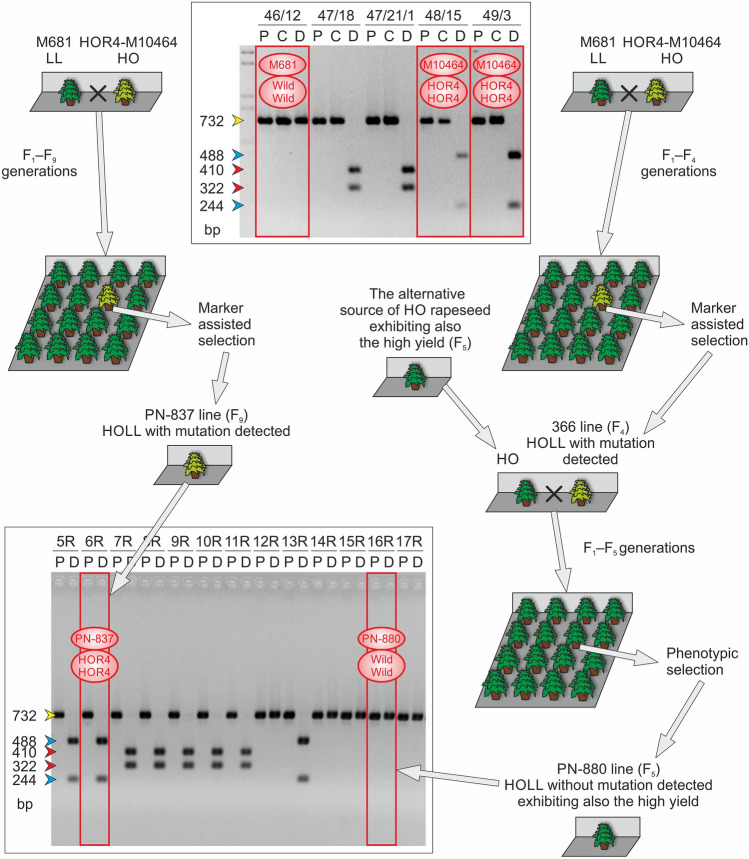
Fig. 4.
The breeding scheme of two HOLL breeding lines (PN-880 and PN-837) exhibiting different CAPS marker genotypes, showing the possible explanation for the observed differences. The relevant CAPS analyses of the progenitor lines and the resulting HOLL lines are also shown (the results for the discussed progenitors and HOLL lines are indicated using red rectangles and the detected alleles of the BnaA.FAD2 gene are named “HOR4” for the mutated alleles and “Wild” for the wild-type alleles). For each analyzed plant, two or three samples (designated with letters P, C, and D, which are explained in Fig. 2) representing two or three steps of the CAPS protocol were applied on the gel. The numbers above each group of lanes refer to the description of the plants delivered by breeders. The arrows on the left side of each gel image indicate the DNA fragments observed on the agarose gel, and their colors correspond to the colors used for the display of each mutation shown in Fig. 1 (color figure online)

