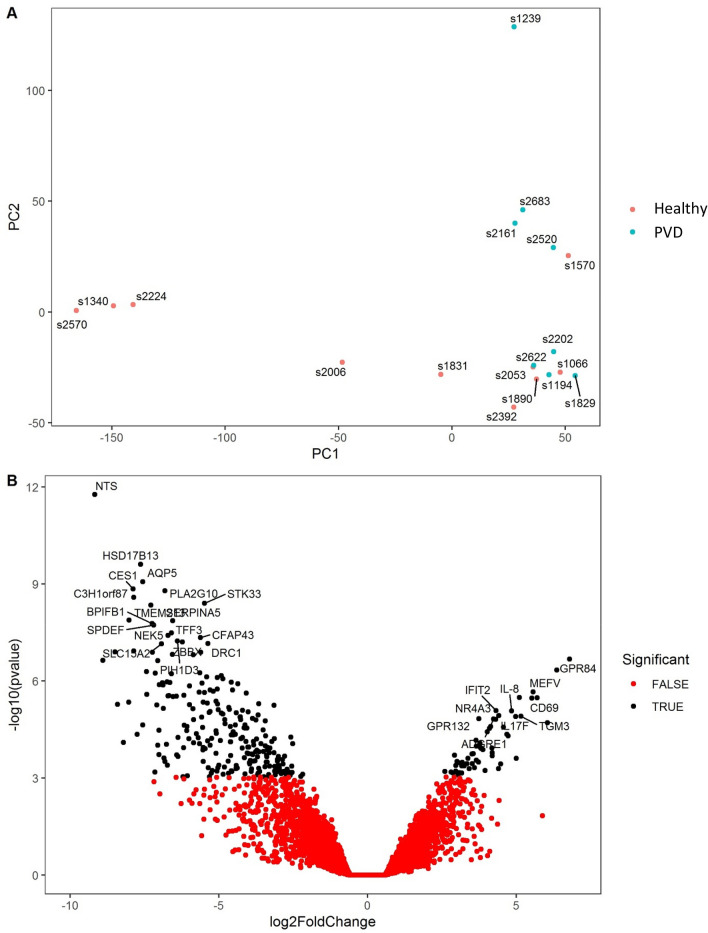
Figure 3.
Differentially expressed genes in the endometrium at 7 DPP in cows that developed PVD (n = 8) relative to cows that remained healthy (n = 10). (A) PCA plot shows distribution of RNA-seq samples, where colours indicate the two groups and numbers refer to specific cow IDs (as detailed in Supplementary Table S1). (B) Gene expression data is presented as a volcano plot using log values of the fold change and p value. Each data point represents a single gene, with those in black representing genes that survived the cut off thresholds of adjusted p < 0.05 and FC > 1. The 100 most significant differentially expressed genes are labelled, where gene names are available.

