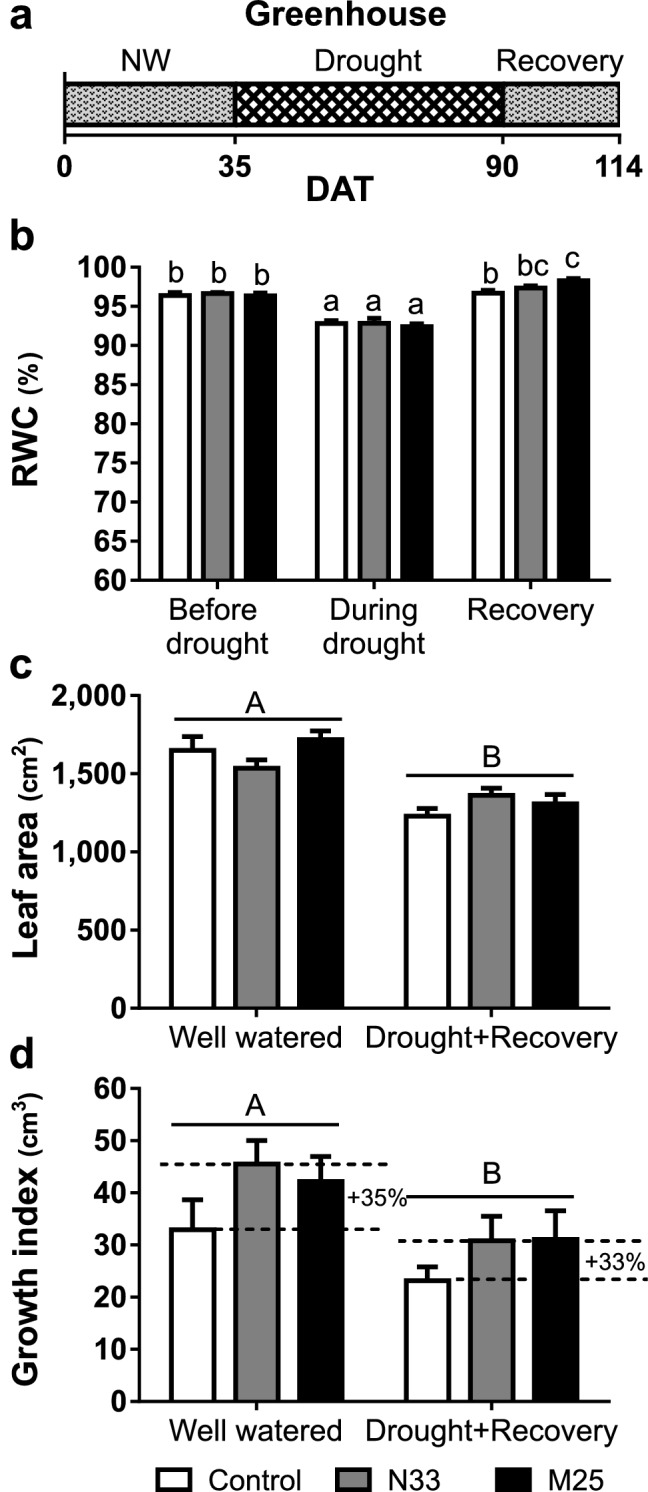
Figure 3.

Physiological evaluation of E. grandis seedlings subjected to gradual drought in a greenhouse. (a) Watering regime for the water deficit experiment. During normal watering (NW) and recovery, the plants were watered to field capacity; during drought, the watering was suspended for 55 days (DAT, days after transplantation). (b) Relative water content (RWC) of individual leaves before and during the drought stress, and 24 days after starting the recovery period (35, 90, and 114 DAT, respectively). (c and d) Growth parameters, computed upon harvesting the plants at the end of the experiment, for well-watered plants and plants subjected to drought and recovery. (c) Total leaf area. (d) Growth index calculated by subtracting the initial volume index (the product of stem height, h and the square of the collar diameter, d2) from the final volume index for each plant. Dotted lines indicate the differences in mean growth index increment between inoculated plants and the non-inoculated controls for the same water condition. Data shown are the means, n = 12, error bars indicate SEM. Different letters indicate significant differences in a two-way ANOVA (P-value < 0.05). Uppercase letters indicate the irrigation factor (well watered, drought or recovery). Lowercase letters indicate the interaction between inoculation (non-inoculated, N33 or M25) and irrigation factors. The inoculation factor was not significant in all cases.
