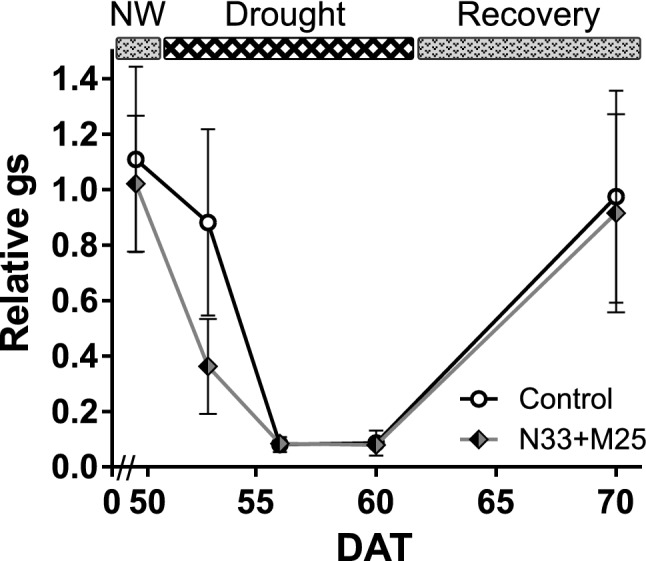
Figure 8.

Stomatal conductance (gs) of E. grandis seedlings grown in a growth chamber and co-inoculated with both bacterial strains. The measures were taken with a leaf porometer. The graph shows the time between the last measurement before imposing the drought stress and the end of the assay. The irrigation scheme is shown on top of the graph (NW, normal watering). Days after transplant (DAT) are shown on the x-axis while y-axis shows the average values of gs for stressed and recovered plants, relative to their well-watered control. n = 8, error bars represent propagated SEM. If not visible, error bars are smaller than the symbols.
