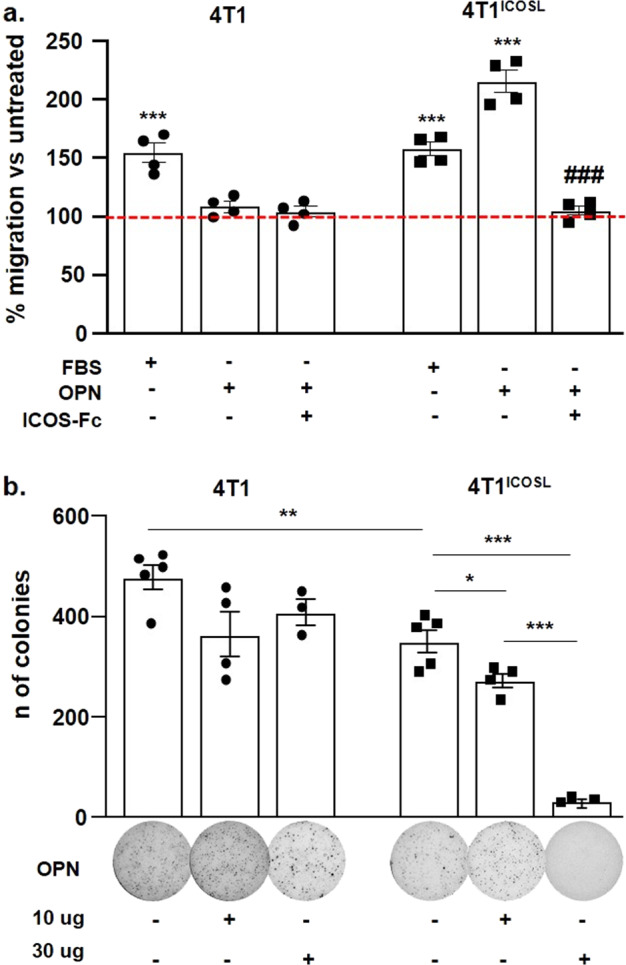
Fig. 7. ICOSL expression promotes tumor-cell migration while inhibiting anchorage-independent cell growth.

a Migration assay of 4T1 and 4TICOSL cells in response to OPN or ICOS-Fc, assessed via a Boyden chamber assay. 4T1 and 4TICOSL cells were plated onto the apical side of Matrigel-coated filters in 50 μl serum-free medium in the presence or not of ICOS-Fc (2 μg ml−1). OPN or FBS loaded in the basolateral chamber as chemotactic stimulus. The cells that migrated to the bottom of the filters were stained with crystal violet and all counted (quadruplicates filters) using an inverted microscope. The dotted line refers to untreated cells (NT). Data are expressed as the number of migrated cells per high-power field, ***P < 0.001 refers to baseline, ###P < 0.001 refers to OPN-induced migration, one-way ANOVA with the post-hoc Tukey multi-comparison test was used (n = 4 technical replicate); b Anchorage-independent growth soft agar assay of 4T1 and 4T1ICOSL transfected cells in response to OPN or PBS (NT). Colonies were counted using Image J Software. The images from one representative experiment are also shown. Please note that images are not fully self-explanatory of each histogram. For the comparison of 4T1 vs 4T1ICOSL cells, the T test was used. For the comparison of 4T1ICOSL, 4T1ICOSL + OPN one-way ANOVA with the post-hoc Tukey multi-comparison test was used (*P < 0.05, ** P < 0.01, *** P < 0.001). (n = 3–5 technical replicate). All data are expressed as means ± standard error.
