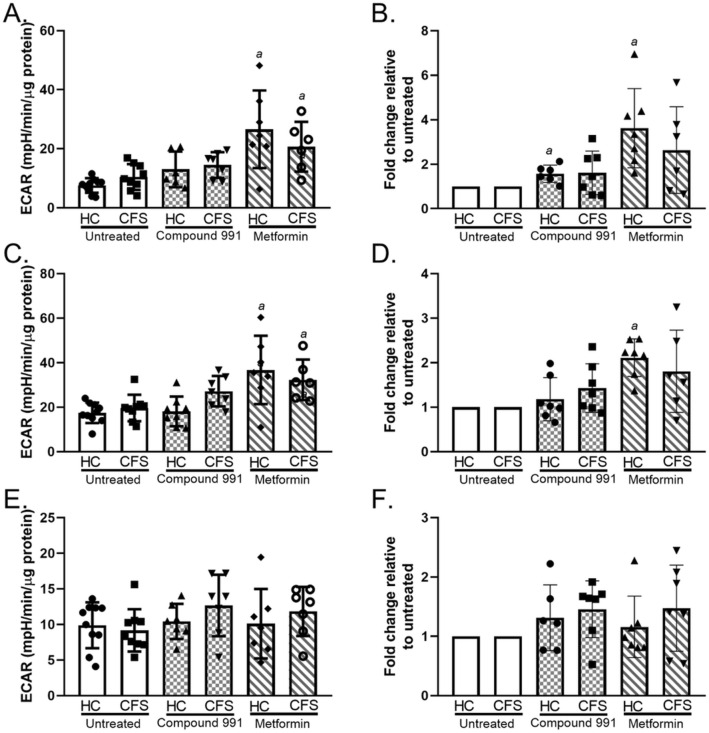
Figure 1.
Results from a glycolytic stress test using CFS (n = 9) and healthy control (n = 10) skeletal muscle cells. Cells were untreated (white bars), treated with 1 µM compound 991 for 2 h (hatched bars), or treated with 2 mM metformin for 16 h (diagonal bars). For treated cells n = 7. (A) Glycolysis. (B) Glycolysis relative changes. (C) Glycolytic capacity. (D) Glycolytic capacity relative changes (E) Glycolytic reserve. (F) Glycolytic reserve relative changes. Groups were compared using two-way ANOVAs with post-hoc Bonferroni correction. HC healthy control; CFS CFS patient; ECAR extracellular acidification rate. a = differs significantly from untreated.

