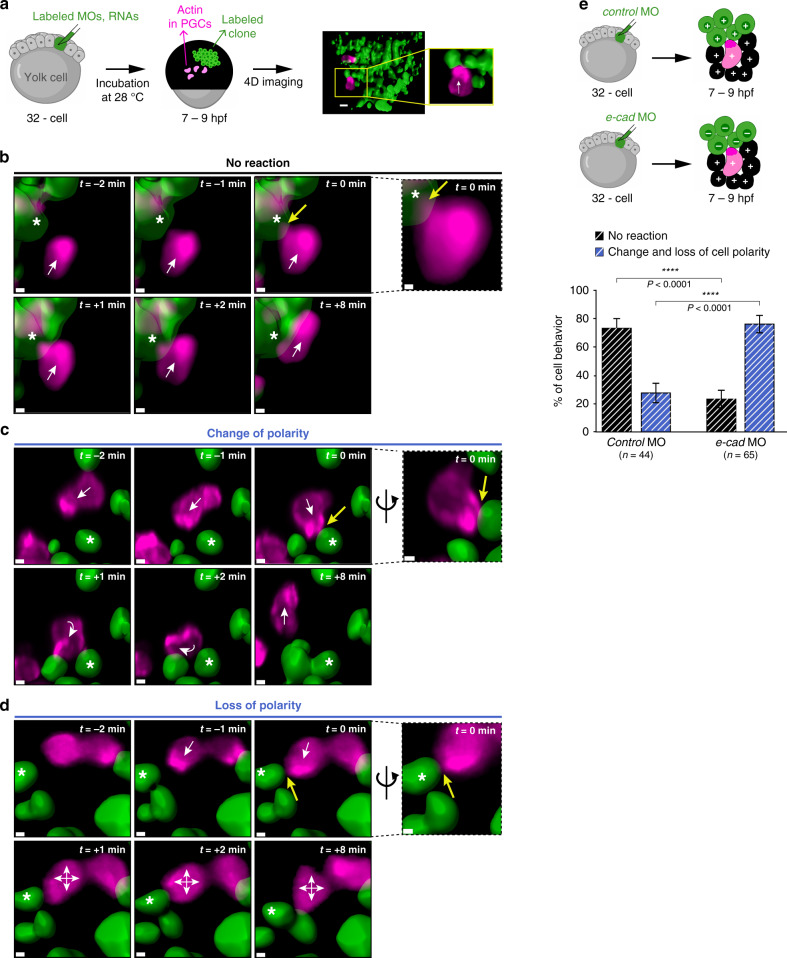
Fig. 5. Behavior of migrating PGCs upon interaction with cellular domains expressing different levels of E-cadherin.
a Schematic representation of the experiments presented in the figure. Cell clones were generated by injecting fluorescently labeled morpholinos (green) and RNAs into one out of 32 blastomeres. The germ cells expressed LifeAct fused to mCherry. Embryos containing the labeled transplant were imaged between 7 and 9 hpf using light-sheet microscopy. The right panels show an example of a polarized PGC that migrates from the non-manipulated area (black) and contacts a MO-treated clone (green). Scale bar, 10 μm; white arrow in the inset indicates the direction of migration. b–d Snapshots showing examples of the three types of behaviors observed upon contact between PGCs and MO-treated clones (e-cadherin MO in these cases): no reaction, change of polarity and loss of polarity (See Supplementary Movies 7, 8 and 9). The separate panels connected with dashed lines on the right provide magnifications of the cells (in c and d, rotated views are presented, with the direction of rotation indicated by the black curved arrows). White stars label the somatic cells contacted by the PGCs; white arrows indicate the direction of migration; min = minutes; t = 0 min indicates the moment of contact; yellow arrows point at the contact point; scale bars, 5 μm. Cells are derived from the same data sets presented in e. Snapshots in b correspond to time points 1 min, 2 min, 3 min (contact), 4 min, 5 min and 11 min in the Supplementary Movie 7. Snapshots in c correspond to time points 0 min, 1 min, 2 min, 3 min (contact), 4 min and 8 min in the Supplementary Movie 8. Snapshots in Fig. 5d correspond to time points 1 min, 2 min, 3 min (contact), 4 min, 5 min and 11 min in the Supplementary Movie 9. e Upper schematics explaining the generation of the two scenarios analyzed in the graph below. Graph: the percentage of PGCs showing no reaction (black striped columns) or change and loss of cell polarity (blue striped columns) upon contact with control clones or clones injected with e-cadherin MO. Mean ± s.e.m.; P value: two-tailed Mann–Whitney U-test; n = number of contact events from 6 independent experiments. Source data are provided as a Source Data file.

