Fig. 1.

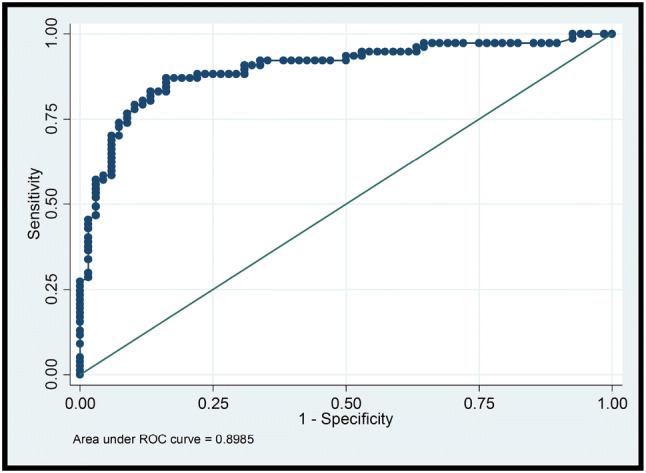
ROC curve that represents, at different cutoff values, the sensitivity and specificity of elastography for discriminating between benign and malignant tumors, considering all lesions in the study sample (). AUC = 0.8985

ROC curve that represents, at different cutoff values, the sensitivity and specificity of elastography for discriminating between benign and malignant tumors, considering all lesions in the study sample (). AUC = 0.8985