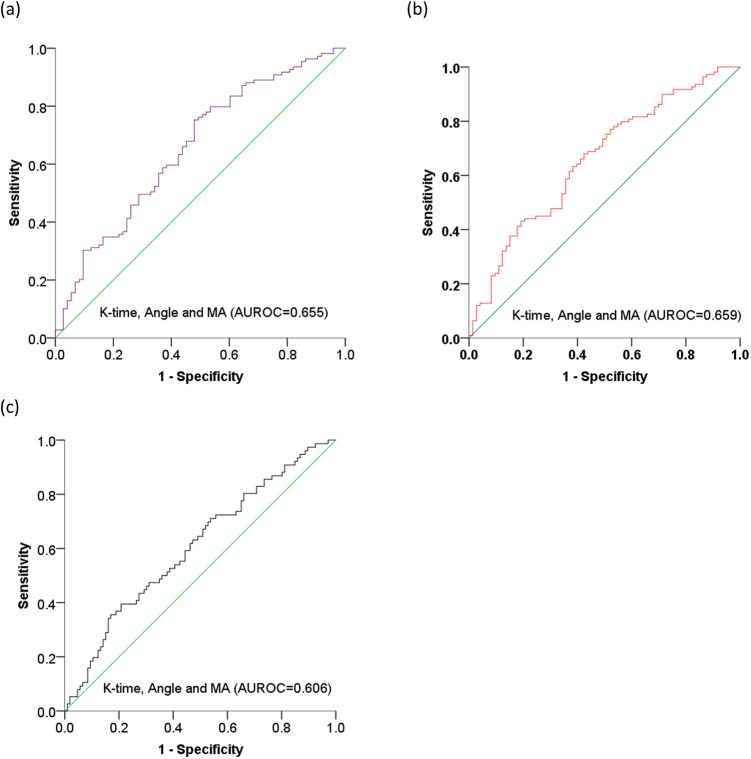
Figure 6.
ROC curve analysis of K-time, Angle, and MA for evaluating TNM staging in patients with lung cancer. Predictive values for (a) stage ≥ II, (b) stage ≥ III, and (c) stage IV. K-time, kinetics time; Angle, α-angle, MA, maximum amplitude; AUROC, area under receiver operating characteristic curve.

