Figure 1.
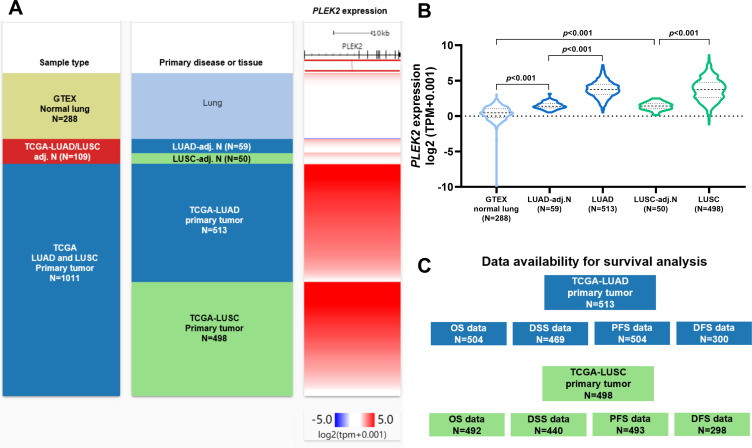
PLEK2 was significantly upregulated in both LUAD and LUSC tissues than in corresponding normal tissues. A-B. A heatmap (A) and a violin plot chart showing the expression of PLEK2 in normal lung (N = 288, from GTEx), LUAD (N = 513, from TCGA pan-cancer), LUSC (N=498, from TCGA pan-cancer) and corresponding adj. N tissues (from TCGA pan-cancer). C. A diagram showing survival data availability in LUAD and LUSC patients from TCGA pan-cancer.

