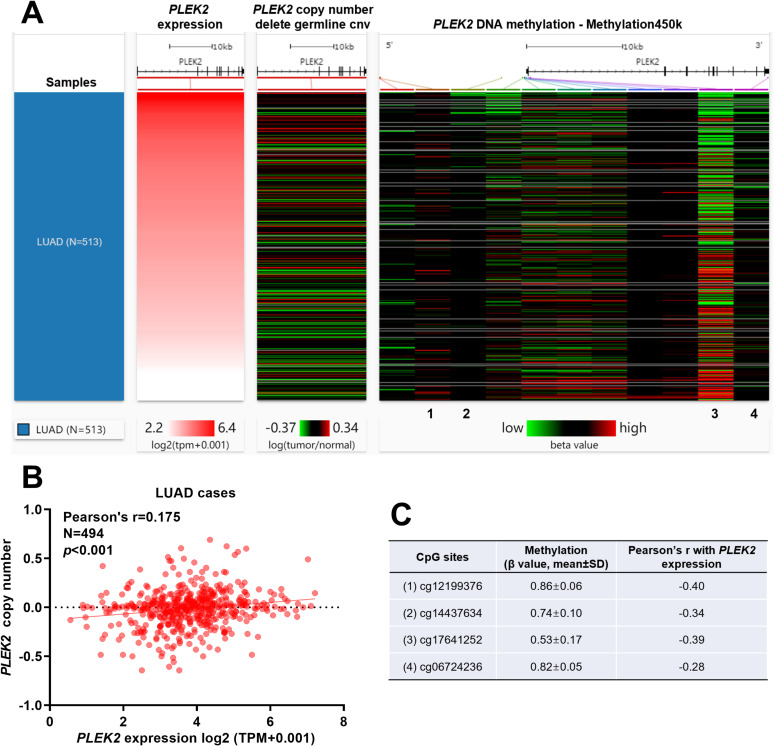
Figure 6.
Gene-level copy number and DNA methylation profile of PLEK2 in LUAD patients. A. A heat map showing the correlation between PLEK2 expression, gene-level copy number, and DNA methylation in LUAD patients (N = 513). B. A plot chart showing the correlation between PLEK2 expression and its gene-level copy number. C. The methylation level (β value) and Pearson’s r value of 4 CpG sites with at least a weakly negative correlation with PLEK2 expression. Their positions were as indicated in figure A.

