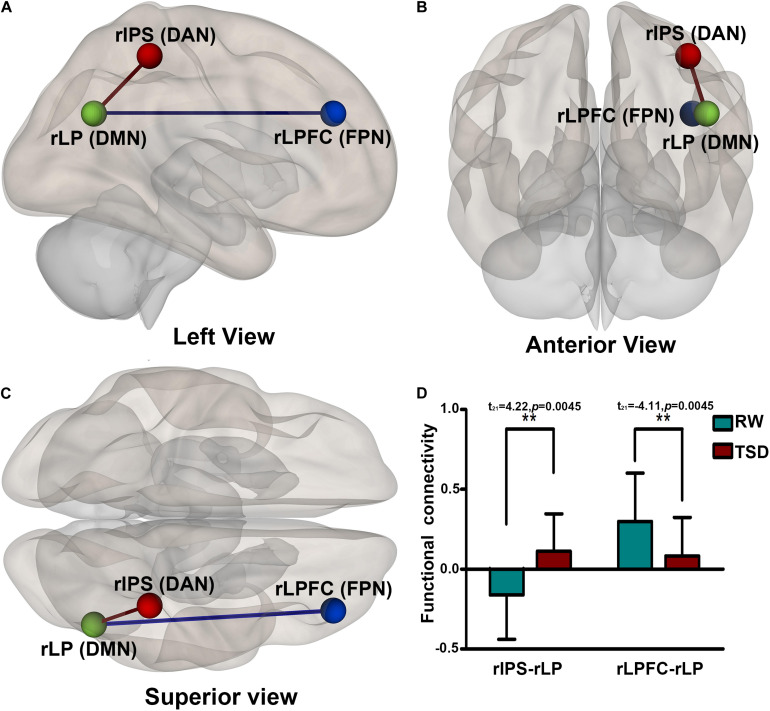
FIGURE 5.
Alerted ROI-to-ROI functional connectivity of networks contrasting in RW vs. TSD scans: Comparing to RW scan, functional connectivity of rIPS-rLP (DAN-DMN) is higher (the red line), and functional connectivity of rLPFC-rLP (FPN-DMN) is lower (the blue line). All the results are shown at panels (A) left, (B) anterior, (C) Superior view, (D) shows the effect size of functional connectivity. [**p < 0.05 FDR set wise corrected for all comparisons across the entire network]. ROI, region of interest; TSD, total sleep deprivation; RW, rested wakefulness; rIPS, right intraparietal sulcus; DAN, dorsal attention network; rLP, right paracentral lobule; DMN, default mode network; rLPFC, right lateral prefrontal cortex; FPN, fronto-parietal network.

