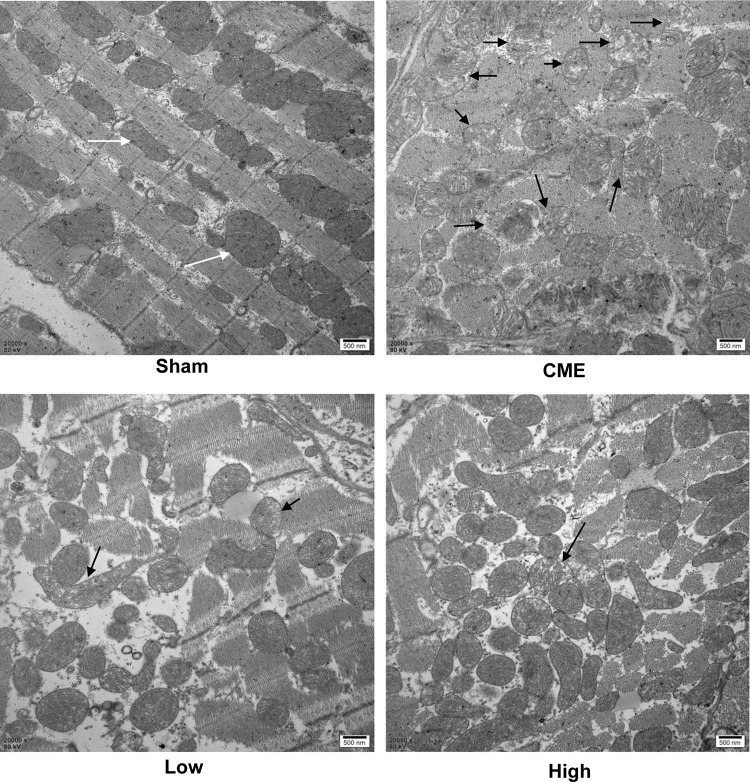
Figure 3.
Myocardial mitochondrial morphology observed by transmission electron microscopy (magnification ×20,000, scale bar=500 nm). The black arrow represents the typical vacuolated degeneration and enlarged mitochondria, and white arrow indicates the normal mitochondrial morphology (n=3 per group).
Abbreviations: CME, coronary microembolization; Low, CME plus alprostadil injection (2 μg/kg); High, CME plus alprostadil injection (4 μg/kg).

