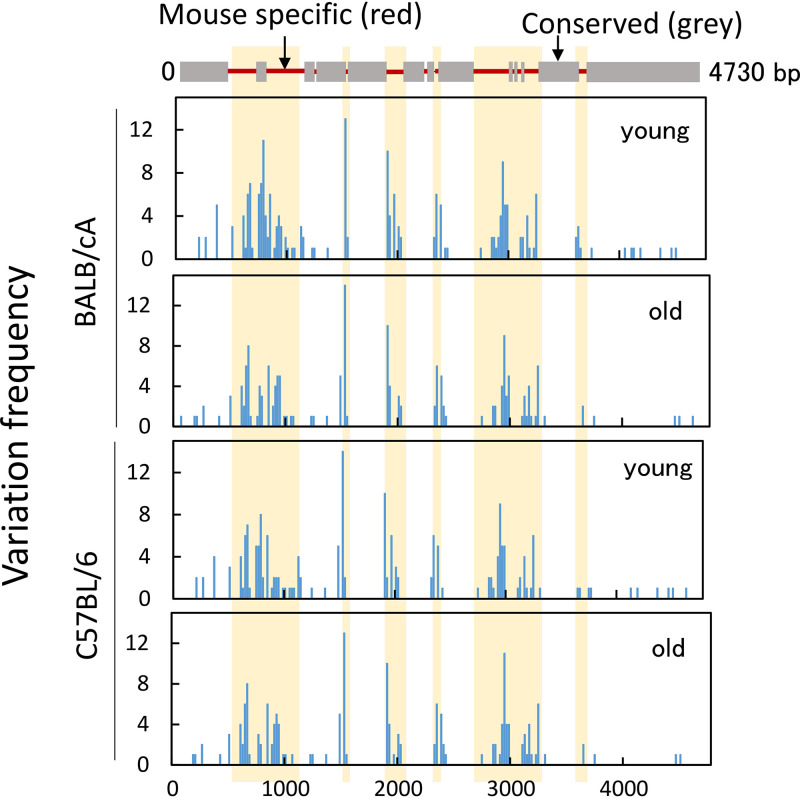
FIG 10.
Hot spot of variation in the 28S rDNA. Mapping of hot spots of variation in the mouse 28S gene. The alignment of the mouse 28S and budding yeast 25S rRNA genes is shown (top). Variation frequency in the 28S rRNA gene was determined (bottom). The mutation rates were summed (variations with a mutation rate of >0.0028 were included) (Fig. 7A) every 20 bp and then plotted. Data from two mice were used in each graph. The yellow boxes represent mouse-specific nonconserved regions.

