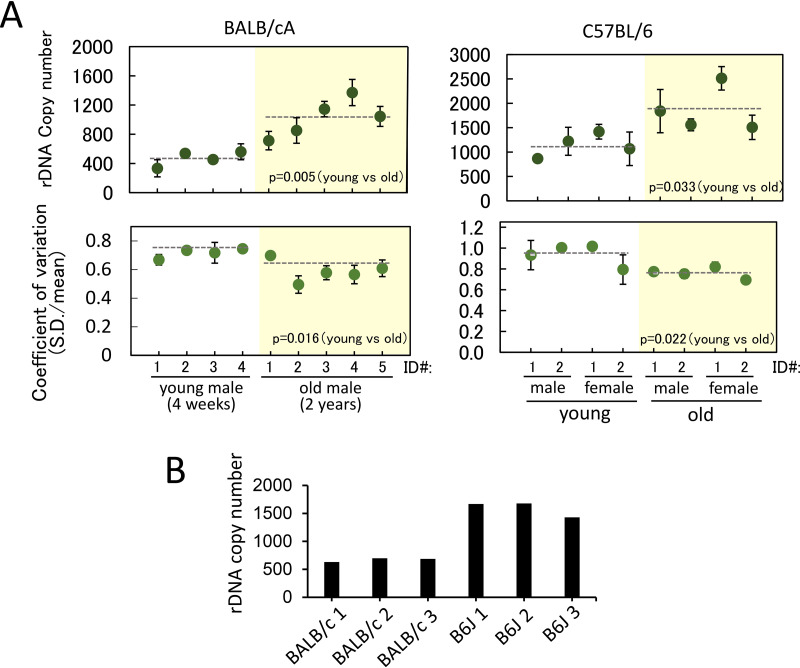
FIG 2.
rDNA copy number and coefficient of variation in individual cells. (A) rDNA copy numbers were measured in young (4-week-old) and old (2-year-old) mice. rDNA copy number in single cells were measured by qPCR and plotted (top). The copy number was determined using RPE1 as a standard (see Materials and Methods). The x axis shows the identification (ID) numbers of individual mice used to isolate the bone marrow cells. The dotted lines represent the average values of the mice. The green dots represent the average of two independent qPCR experiments from each mouse, and the error bars indicate the range. Plots of coefficient of variation (SD divided by the average) for each mouse are shown (bottom). (B) Estimated rDNA copy number based on a whole-genome sequencing database. rDNA copy numbers of BALB/cA (BALB/c 1 to 3) and C57BL/6 (B6J 1 to 3) mice were estimated by reanalysis of a publicly available whole-genome sequencing database. rDNA copy number estimation based on whole-genome sequencing data was performed as follows. Fastq files obtained from the NCBI Sequence Read Archive (SRA; accession numbers PRJNA41995 and PRJNA386034) were mapped against mouse whole-genome and rDNA sequences using Bowtie 2, and the fraction of rDNA reads among all mapped reads was used to calculate the copy numbers.

