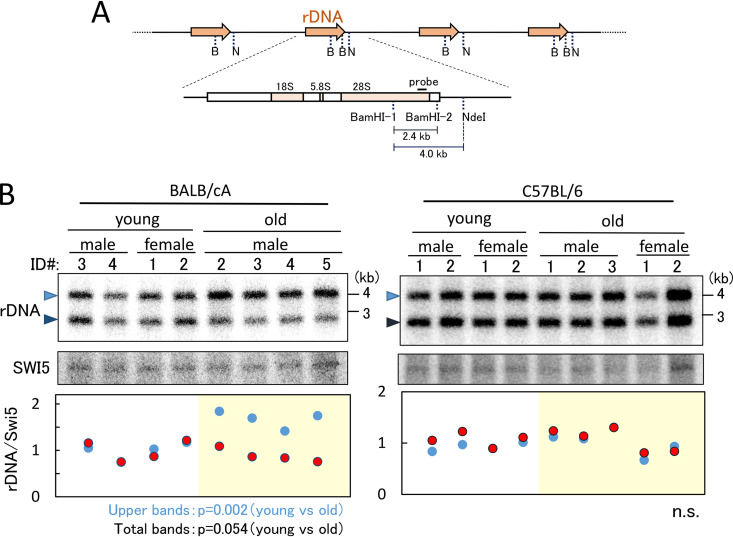
FIG 3.
Detection of relative rDNA copy number in old and young mice. (A) The position of the probe for the Southern blot analysis shown in panels B and C and recognition sites for BamHI (B) and NdeI (N) are shown. (B and C) Detection of relative rDNA copy number. Southern analysis for rDNA copy number is shown at the top. DNA was digested with BamHI and NdeI. Upper bands (4 kb) come from rDNA units without the BamHI-2 site, and lower bands (2.4 kb) are from rDNA units with the BamHI-2 site. The SWI5 gene was used as a loading control (middle). The single-copy gene SWI5 was detected on the same filter used for the experiment shown in the upper panel. Relative rDNA copy numbers were determined (bottom). The band intensities of rDNA were normalized by those of SWI5, and the values are relative to the average of rDNA values in the four young mice. The blue dots show the results from the upper-band intensities of rDNA, and the red dots are the results from the lower bands. Individual mice that were used to isolate the bone marrow cells are identified by number (ID) (Fig. 2). P values are shown at the bottom of the panel. n.s., not significant.

