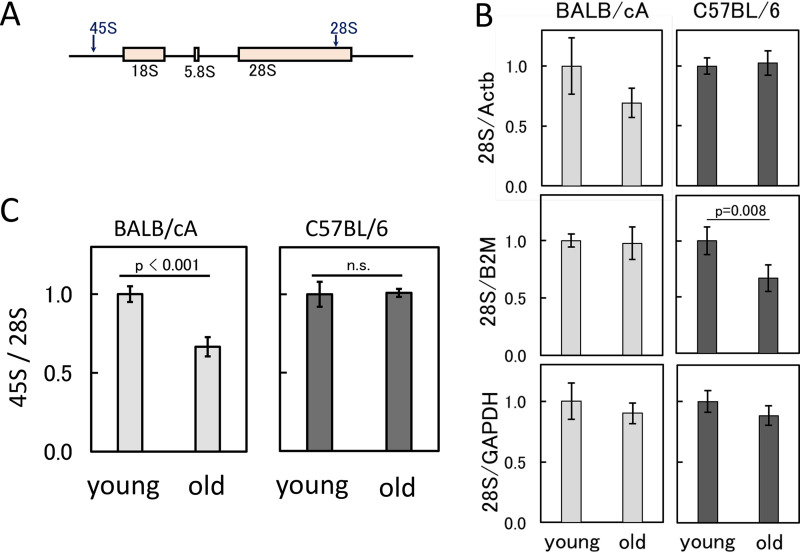
FIG 4.
rDNA transcripts in old and young bone marrow cells. (A) Positions of the primer sets for qPCR to measure rDNA transcripts (pre-45S and 28S rRNA). (B) Amount of 28S rRNA normalized by transcripts of the three housekeeping genes (GAPDH, B2M, and Actb genes). The values are the average of four independent experiments, and the error bars indicate SDs. The values are relative to those of young cells. P values are shown if significant (P < 0.05). (C) Ratio of the pre-45S rRNA to 28S rRNA. The values are the average of four independent experiments, and the error bars indicate SDs. The values are relative to those of young cells. n.s., not significant.

