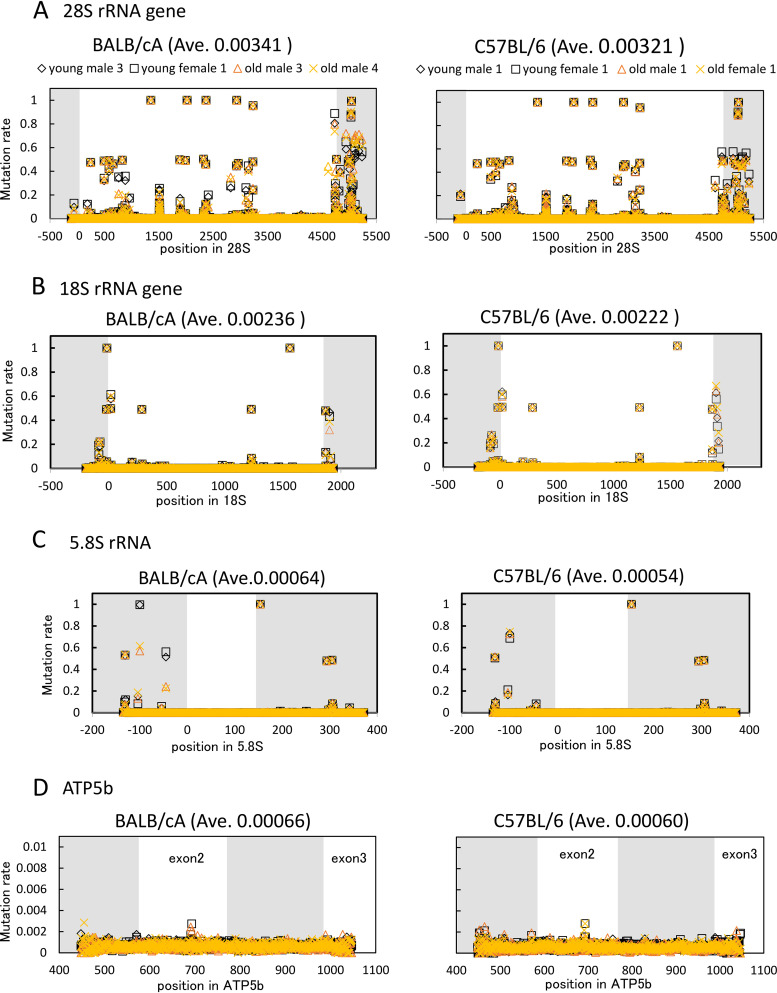
FIG 7.
rDNA sequence variation in young and old mice. The rDNA sequences from two old and two young mice were determined and compared to the reference sequence. Mutation rates were then calculated at each nucleotide position for the indicated genes. Noncoding regions are shown in gray. The mutation rate is the difference in the sequence from the reference sequence. Ave, average mutation rate.

