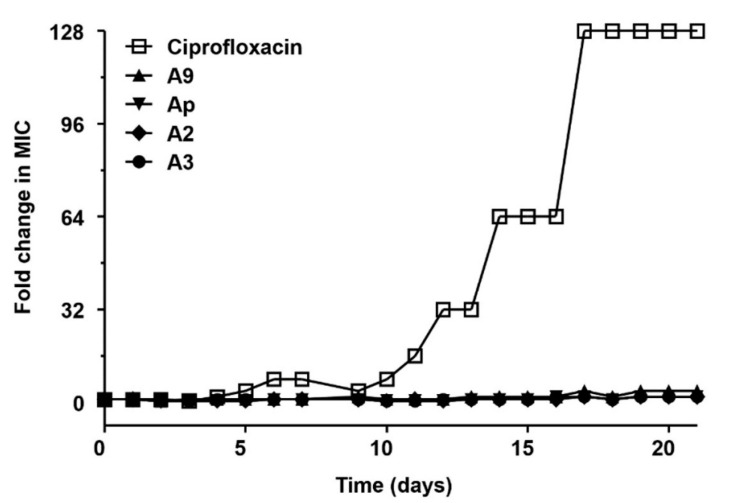
Figure 4.
Resistance acquisition during 21 serial passaging (21 days) in the presence of sub-MIC (0.5 × the MIC determined from the previous passage) levels of ciprofloxacin, chromomycin A9 (1), Ap (2), A2 (3), and A3 (4) for S. aureus ATCC43300. The y axis is the highest concentration the cells grew to during passaging. For ciprofloxacin, 128 × MIC was the highest concentration tested. The figures are representative of three independent experiments.

