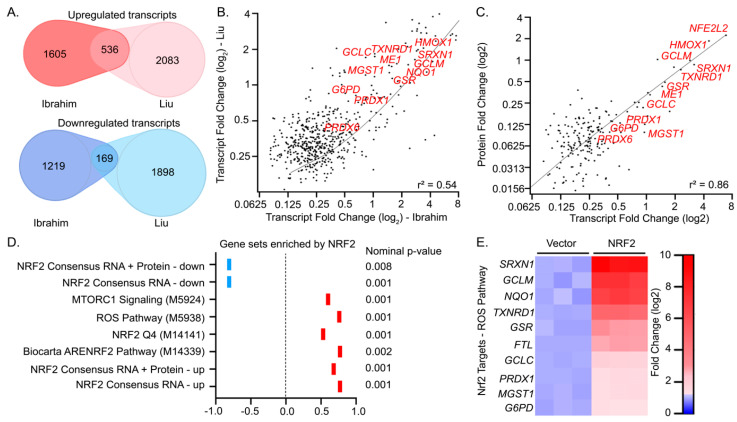
Figure 4.
A consensus set of NRF2 target genes associated with oxidative stress resistance. (A) Venn diagram depicting the overlapping and differentially expressed transcripts induced by NRF2 activation identified in this work (Ibrahim, p < 0.05 and absolute value log2 fold change > 0.075) in comparison to those obtained with reported inducible U2OS-based system (Liu et al.). (B) Plot depicting the linear relationship of differentially expressed transcripts derived from the common targets in this work and from Liu et al. (C) Linear regression plot of log2 fold change values of protein and transcript levels of significantly changed genes in response to NRF2 overexpression. (D) Summary of GSEA analysis of RNA-seq profiling in response to NRF2 overexpression. (E) Heatmap depicting log2 fold change of transcript levels associated with a response to ROS that is upregulated by NRF2 overexpression by DAVID analysis.

