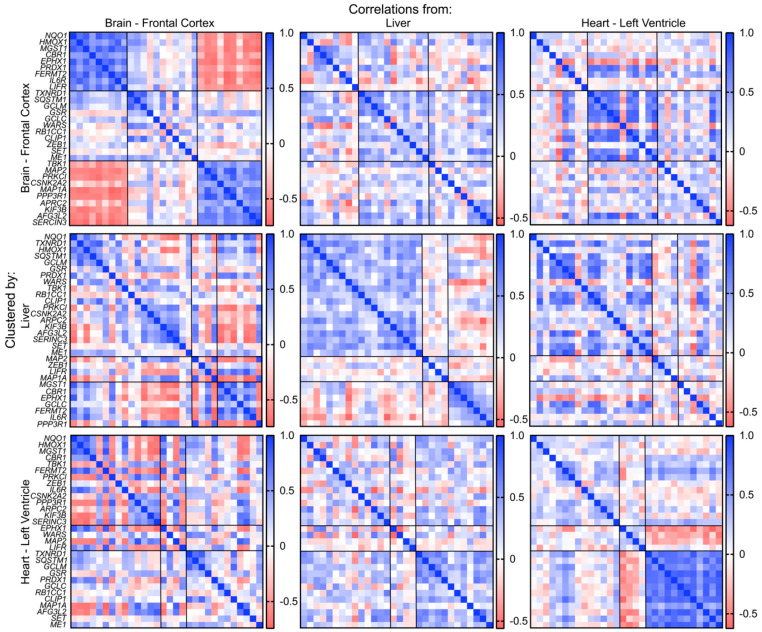
Figure 7.
Co-expression patterns of NRF2 target transcripts in human tissues. Genes are separated into three groups by hierarchical clustering. First row: Correlation matrices of brain, liver, and heart clustered by the similarity of correlation patterns in the brain. Second row: Correlation matrices of brain, liver, and heart clustered by the similarity of correlation patterns in the liver. Third row: Correlation matrices of brain, liver, and heart clustered by the similarity of correlation patterns in the heart.

