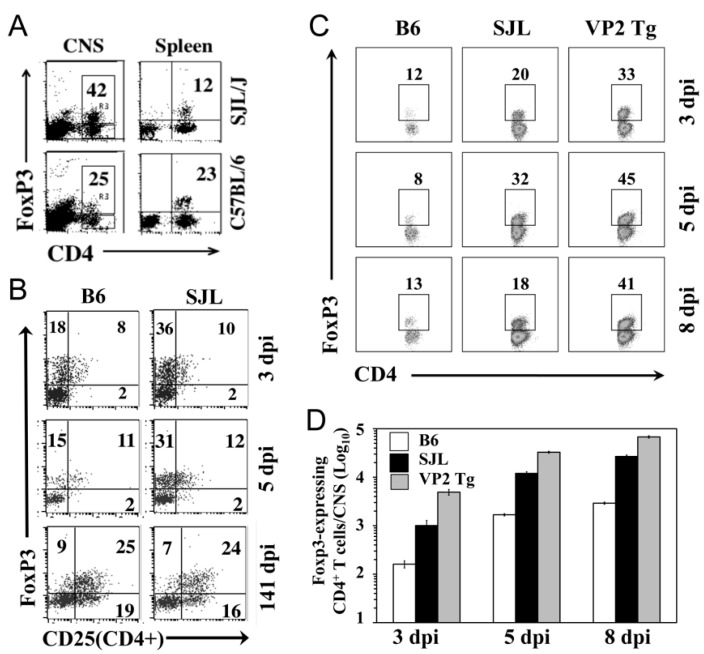
Figure 5.
Comparison of FoxP3+CD4+ T cells in the CNS of C57BL/6, SJL, and TCR-Tg mice early after TMEV infection. (A) The proportions of FoxP3+CD4+ T cells in the CNS and spleens of TMEV-infected B6 and SJL mice at 5 d postinfection. (B) The expression of CD25 on FoxP3+CD4+ T cells in the CNS of TMEV-infected SJL and B6 mice at 3, 5, and 141 d postinfection. (C) The proportions of FoxP3+CD4+ T cells in the CNS of TMEV-infected B6, SJL, and TCR-Tg SJL mice at 3, 5, and 8 d postinfection. (D) The numbers of FoxP3+CD4+ T cells accumulated in the CNS of TMEV-infected B6, SJL, and TCR-Tg SJL mice at 3, 5, and 8 d postinfection.

