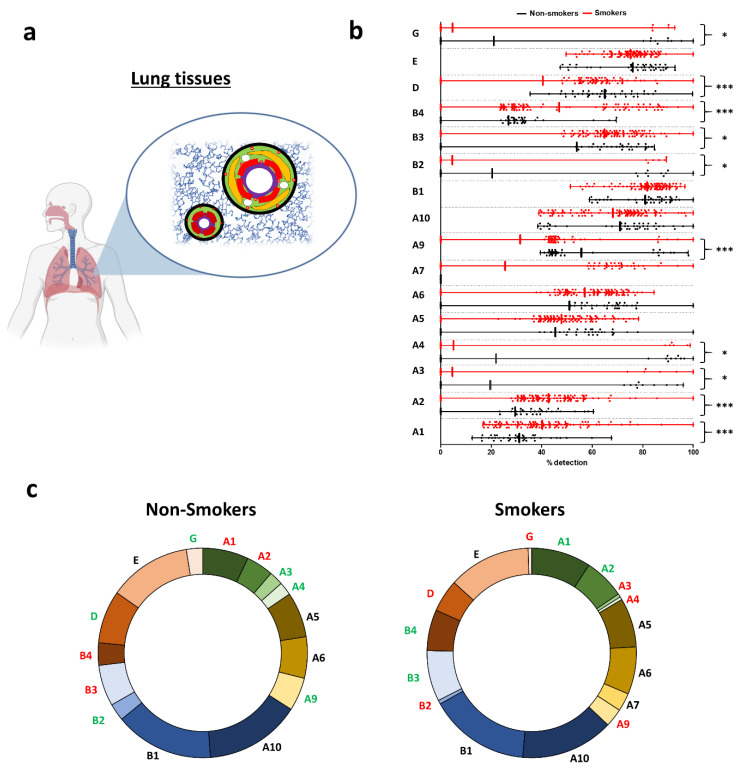
Figure 1.
Evaluation of nicotinic acetylcholine receptor (nAChR) transcript levels in human lung tissues. (a) Illustration depicting the origin of the samples. Whole-lung tissues contained all the tissues present in the lung either in parenchyma or in/around bronchi and bronchioles. (b) Histogram showing the detection of nAChRs in non-smokers (black) and smokers (red). * p < 0.05; *** p < 0.001 non-smokers (n = 42) vs. smokers (n = 111). (c) Pie charts showing the repartition of nAChRs in non-smokers (left) and smokers (right). Coloured subunits indicate upregulation (green) and downregulation (red) in both groups when statistically significant.

