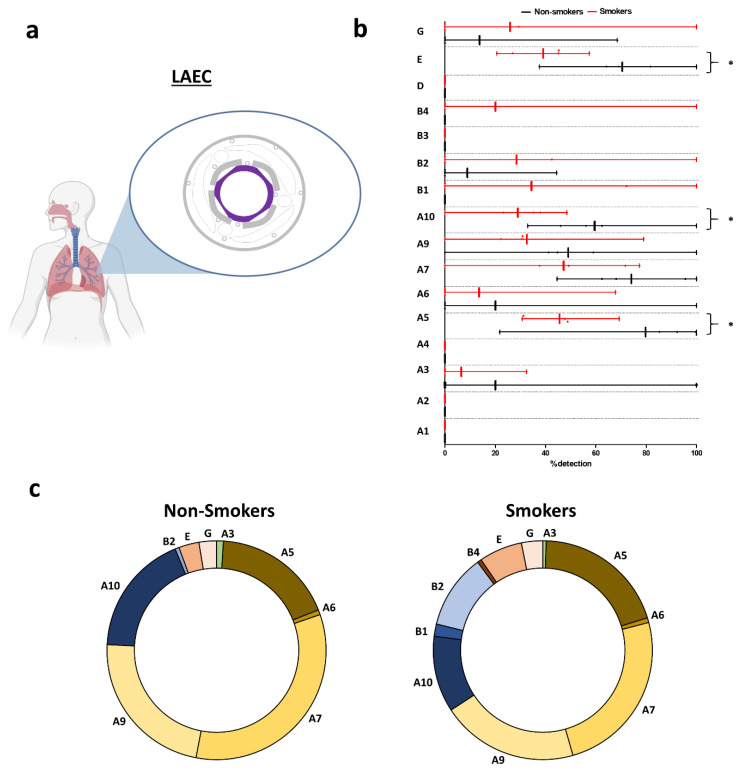
Figure 2.
Evaluation of nAChR transcript levels in human large airway epithelial cells (LAECs). (a) Illustration depicting the origin of the samples. Isolated AECs were collected from bronchi. Large airway epithelial cells (LAECs) are depicted in purple. (b) Histogram showing the detection of nAChRs in non-smokers (black) and smokers (red). * p < 0.05 non-smokers (n = 5) vs. smokers (n = 5). (c) Pie charts showing the repartition of nAChRs in non-smokers (left) and smokers (right).

