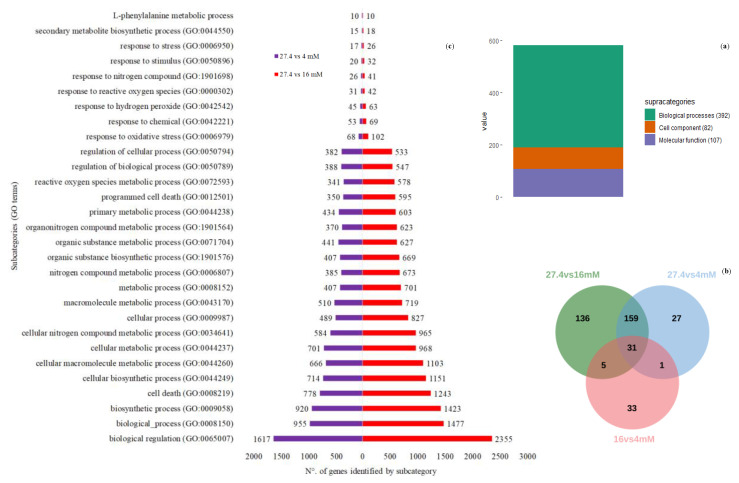
Figure 6.
Pie chart (a) showing the distribution of the 587 subcategories identified within the 3 different Gene Ontology (GO) major categories. All these subcategories resulted from analysis of the enrichment of GO terms in the lists of differentially expressed genes. The Venn diagram (b) depicts the number of shared and unique functional subcategories belonging to the “biological process” category resulting from the differentially expressed genes identified by pairwise comparison of treatments (27.4 mM vs 16 mM, 27.4 mM vs 4 mM, 16 mM vs 4 mM). Finally, (c) shows some GO terms enriched with the highest number of grouped differentially expressed genes. Some of these categories are discussed and can explain (at least in part) the biological phenomenon of nitrate deficiency responses evaluated in this study.

