
Figure 2. Associations of Sociodemographic, Psychosocial, and Health-Related Risk Factors With the Moderate and Severe Depressive Symptom Trajectories.
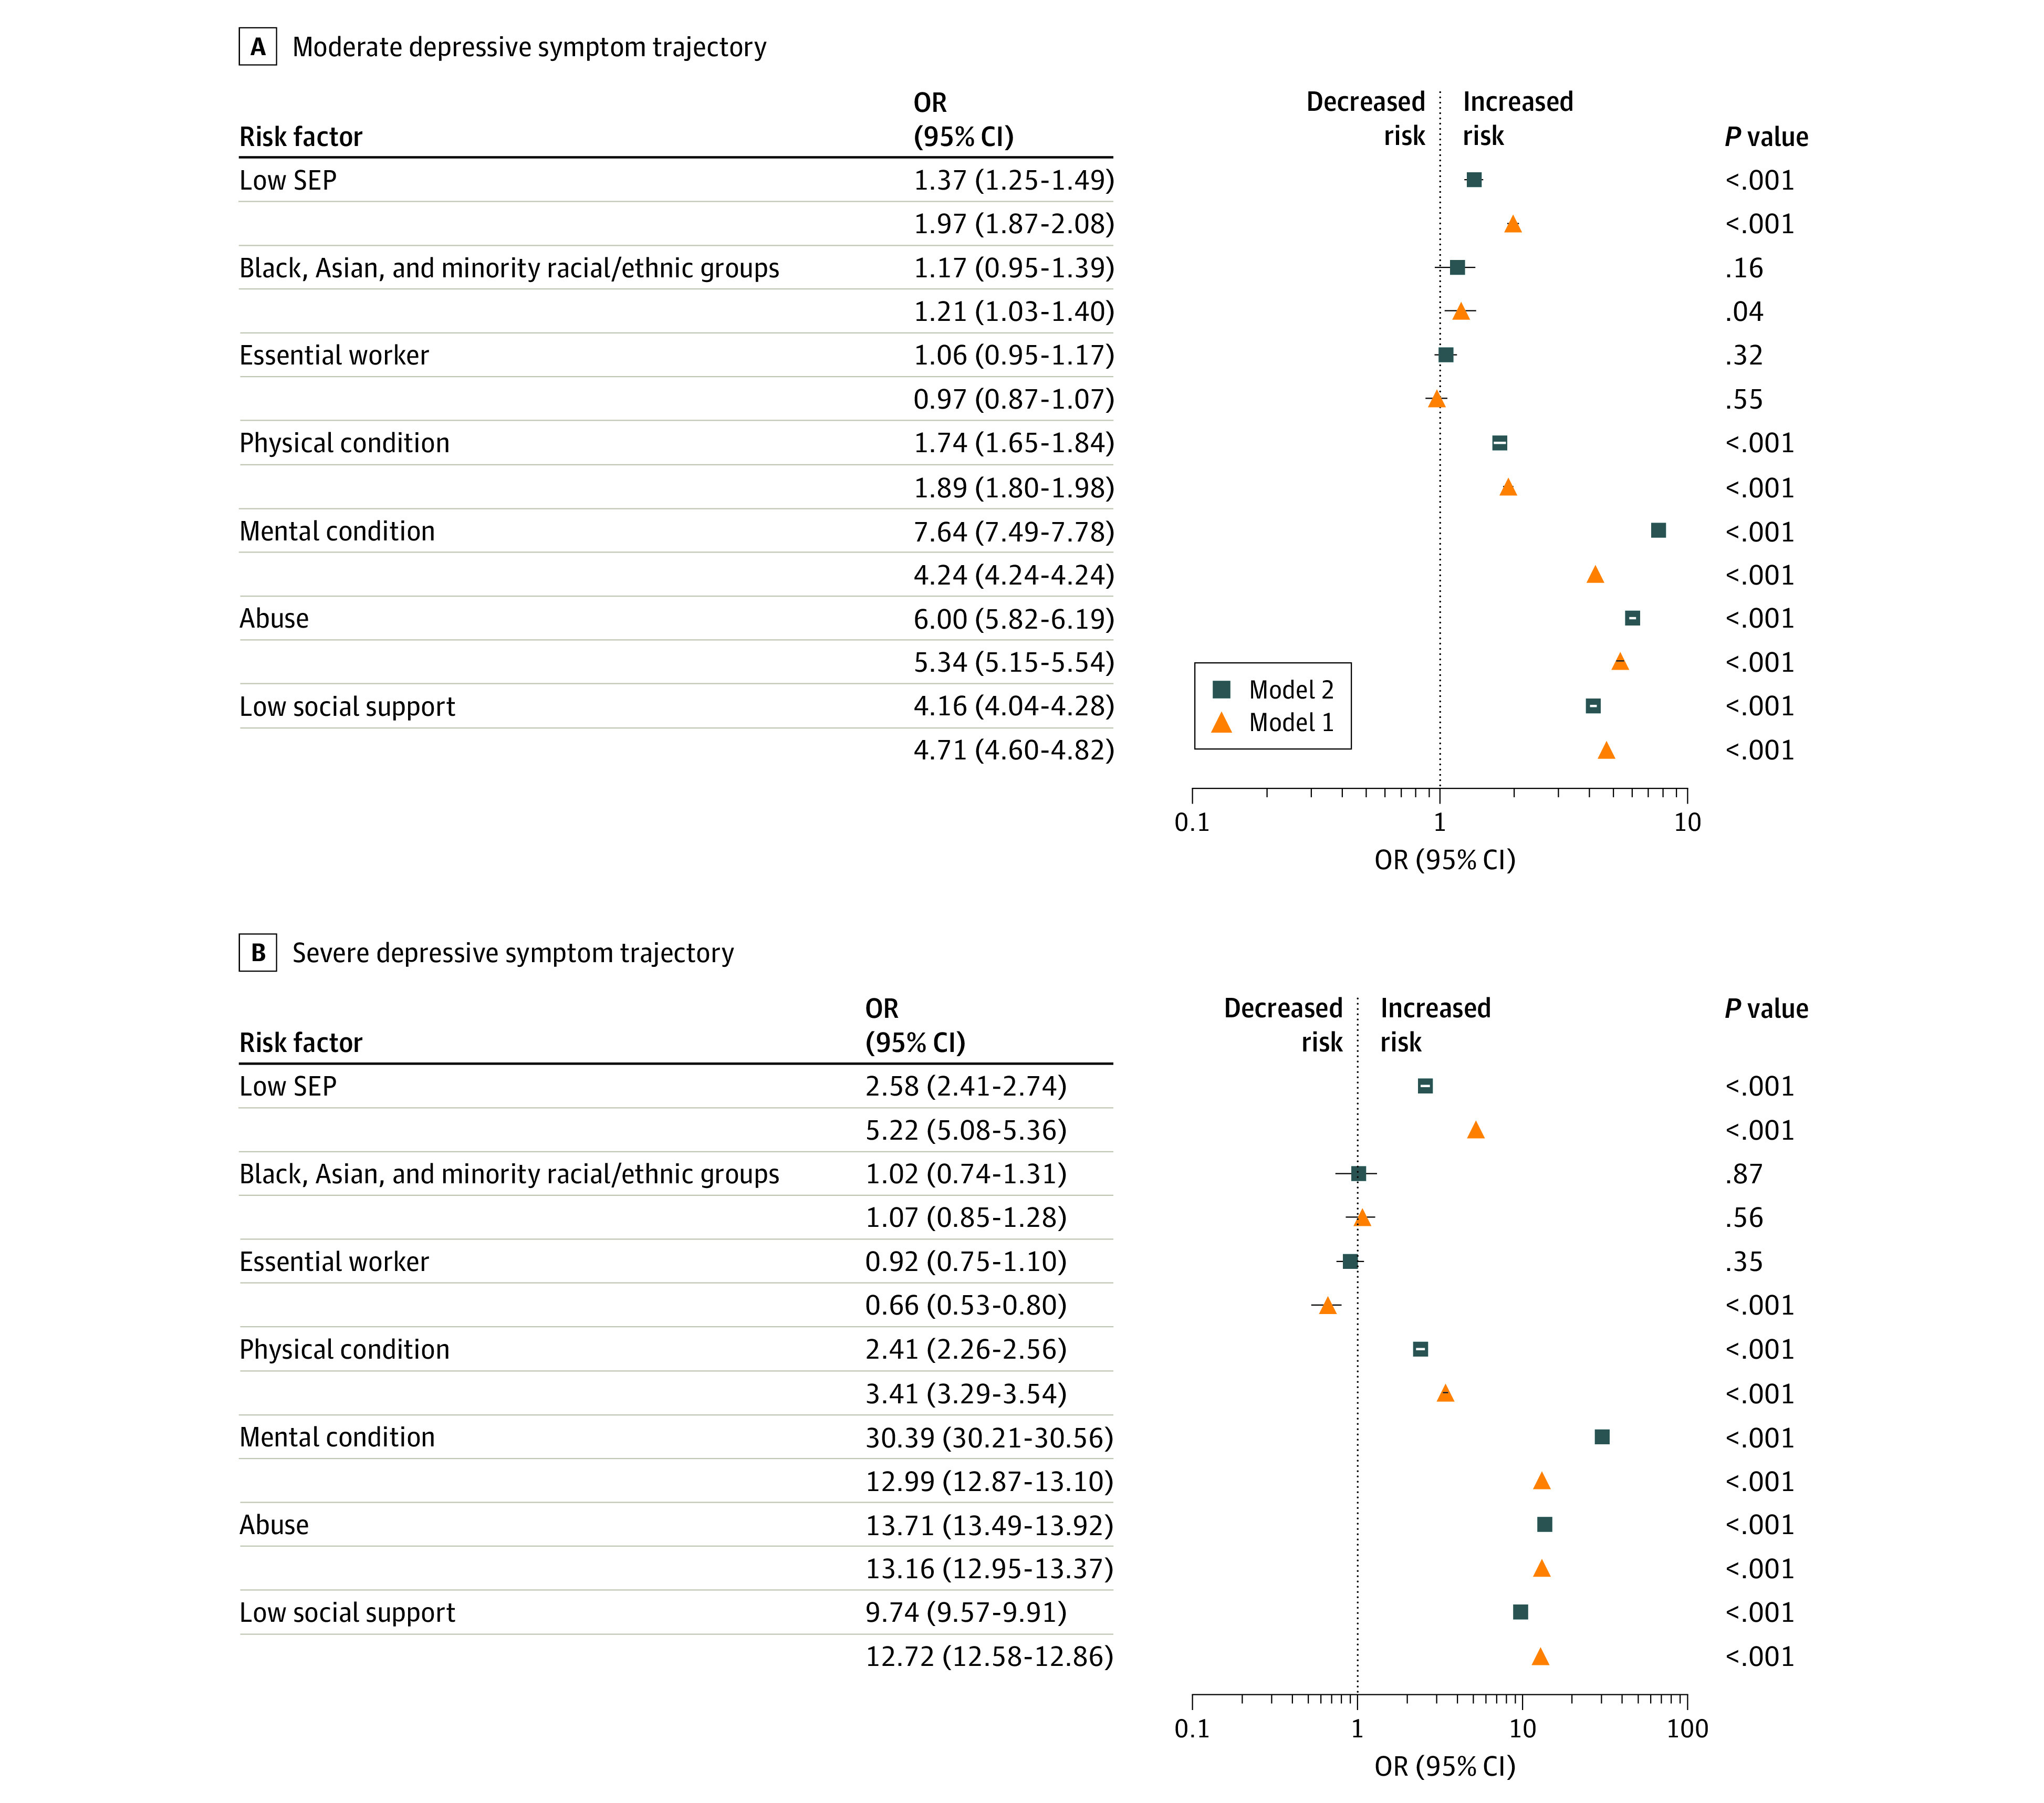
The odds ratios (ORs) represent the risk of belonging to the moderate or severe depressive symptom trajectory compared with the low trajectory and are plotted on the log scale. All models were adjusted for sex, age, and coronavirus disease 2019 diagnosis and weighted using survey weights. Model 1 further adjusted for each exposure, and model 2 adjusted for all exposures simultaneously. SEP indicates socioeconomic position.