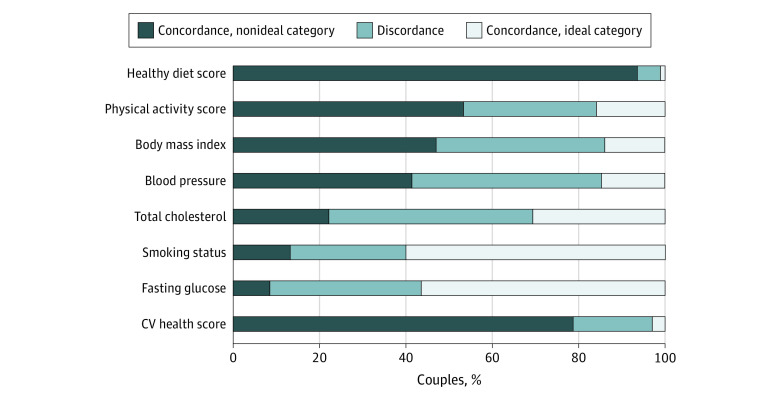
Figure 1. Percentage of Couples in Concordance Categories of CV Risk Factors and Behaviors.
Percentage of couples in concordance categories of each CV risk factor and behavior is indicated. Couples were considered in concordance of a nonideal category when both were in nonideal categories (dark blue), in concordance of an ideal category when both were in the ideal category (light gray), and in discordance otherwise (gray).

