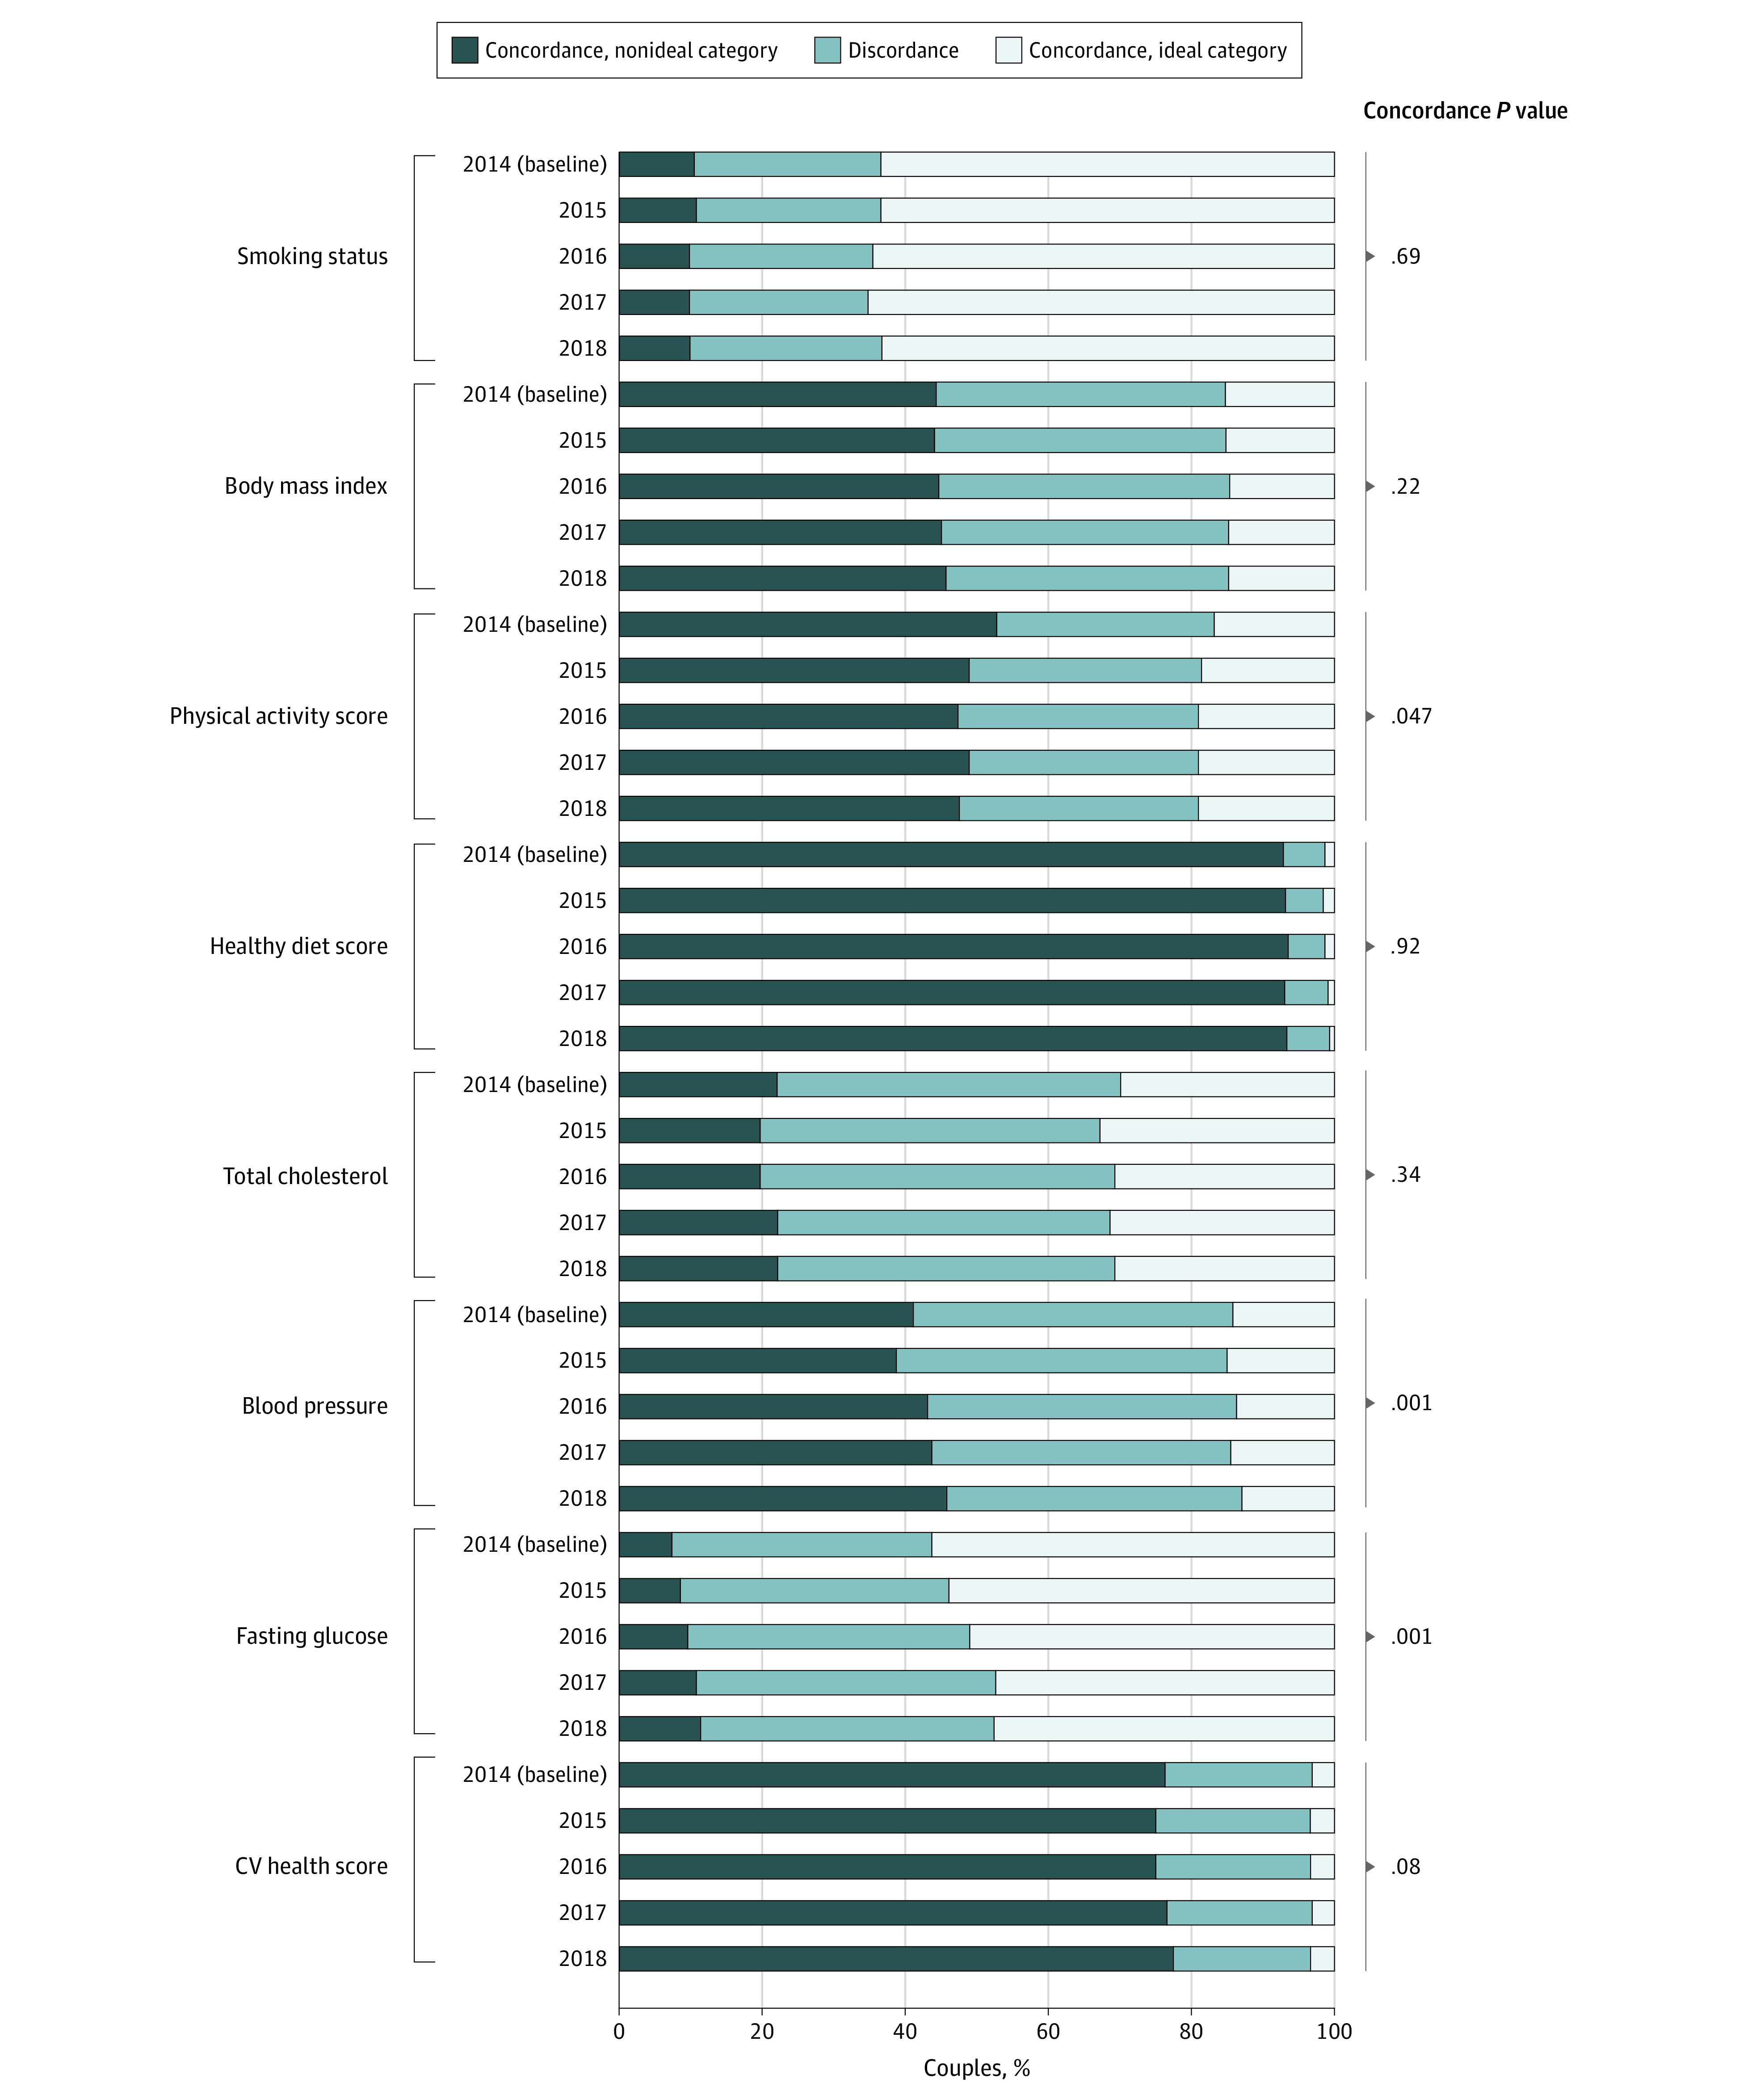
Figure 2. Percent of Couples in Concordance Categories of CV Risk Factors and Behaviors During 5 Years.

Percent of couples in concordance of each CV risk factor or behavior is indicated for baseline year (2014) and each follow-up year. Couples were considered in concordance of a nonideal category when both were in nonideal categories (dark blue), in concordance of an ideal category when both were in the ideal category (light gray), and in discordance otherwise (gray). P values assess the change in percent of concordant couples (combined ideal and nonideal) over time.
