Fig. 3.

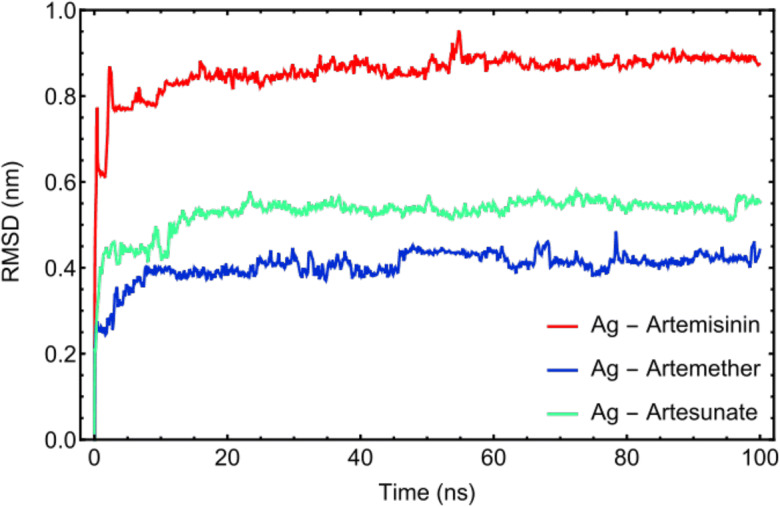
RMSD plots of drug molecules: Artemisinin, Artemether, and Artesunate versus simulation time. The MD trajectories after 20 ns have been taken for further analysis

RMSD plots of drug molecules: Artemisinin, Artemether, and Artesunate versus simulation time. The MD trajectories after 20 ns have been taken for further analysis