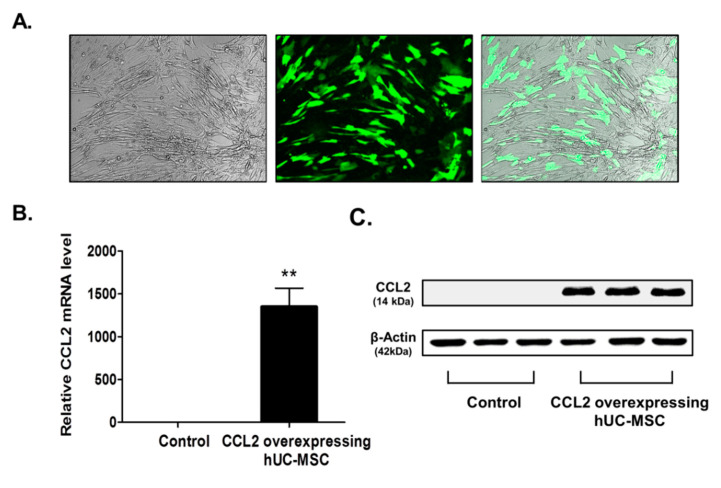
Figure 1.
Confirmation of CCL2 overexpression following transfection into hUC-MSCs. (A) At 24-h post-transfection, hUC-MSCs observed in the bright field expressed GFP by fluorescence microscopy, and (B) RT-PCR results indicated CCL2 mRNA levels. Data represent fold changes relative to GAPDH and are presented as the mean ± SEM. ** p < 0.01, Student’s t test. (C) Western blot analysis showing CCL2 protein levels at 24-h post-transfection. CCL2-specific bands were quantified and normalized against those of β-actin. Scale bar = 100 µm.

