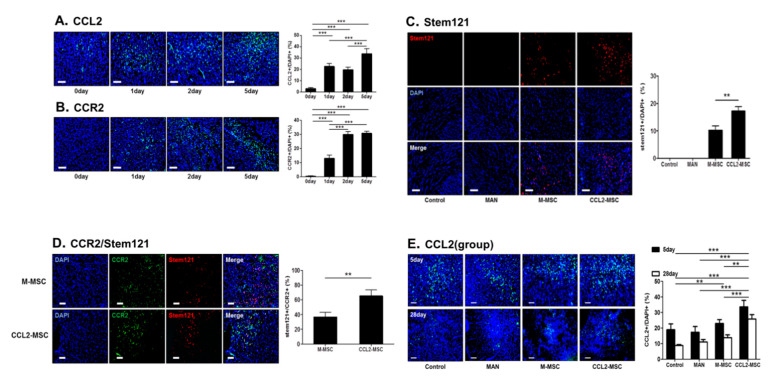
Figure 4.
Changes in CCL2 and CCR2 levels in the brain during the acute stroke phase and correlations between MSC migration and CCR2 levels following transplantation. (A,B) Representative immunostaining images showing changes in CCL2 and CCR2 levels on days 1, 2 and 5 after MCAo induction as compared before induction. The graph shows the number of CCL2+ or CCR2+ cells in each group. Data were analyzed by one-way ANOVA test. (C) The CCL2-MSC group showed enhanced engraftment into the peri-infarct area relative to the M-MSC group. The graph shows the number of Stem121+ cells in the peri-infarct area in each group. Data were analyzed using a paired Student’s t test. (D) Co-immunostaining images of CCR2+ and Stem121+ cells in the peri-infarct area in each group on 5 day after MCAo induction. The graph shows the number of Stem121+/CCR2+ cells in each group. Data were analyzed using a paired Student’s t test. (E) Representative immunostaining images showing changes in CCL2 levels at 5 and 28 days after MCAo induction between treatment groups. The graphs show the number of CCL2+ cells in each group. Data represent the mean ± SEM and were analyzed by one-way ANOVA. ** p < 0.01, *** p < 0.001. Scale bar = 100 μm.

