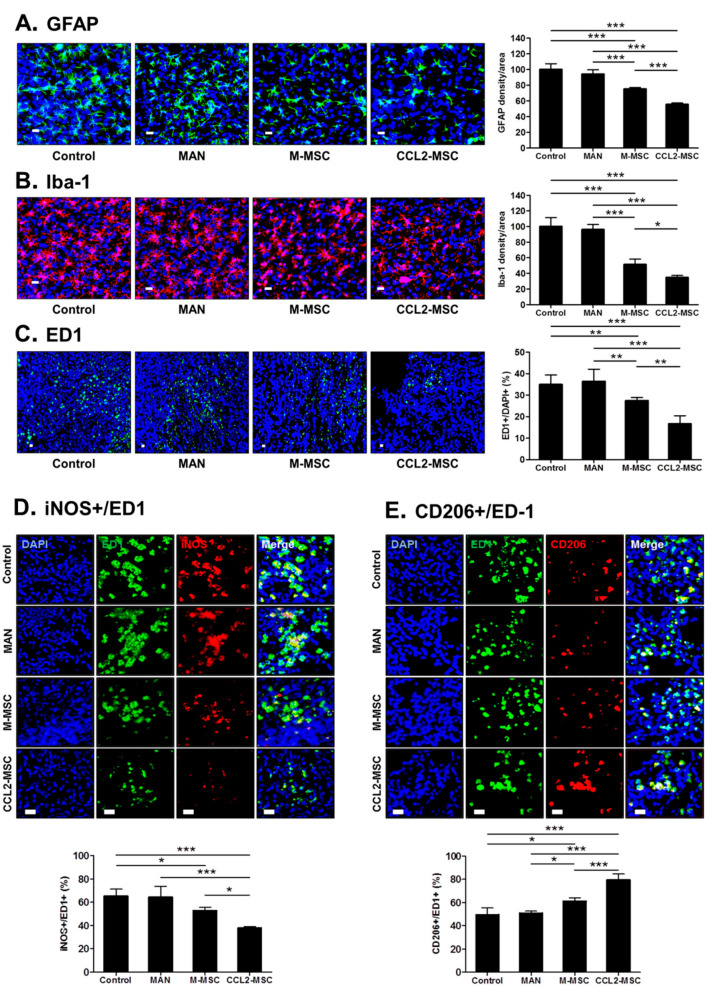
Figure 7.
Changes in inflammation in the peri-infarct area following hUC-MSC transplantation. Immunostaining analyses were performed 28 days after MCAo induction. (A) Images showing GFAP+ cells in the peri-infarct area. The graph shows the density of GFAP+ cells per area in each group. (B) Representative immunostaining images showing Iba-1+ cells in the peri-infarct area. The graph shows Iba-1+ cells per area in each group. (C) Representative immunostaining images showing ED-1+ cells in the peri-infarct area. The graph shows the number of ED1+ cells in each group. (D, E) Immunostaining images showing iNOS+ cells and CD206+ cells in the peri-infarct area in each group. Each graph shows the iNOS+:ED1+ cell ratio and CD206+:ED-1+ cell ratio in each group. Data represent the mean ± SEM and were analyzed by one-way ANOVA. * p < 0.05, ** p < 0.01, *** p < 0.001. Scale bar = 20 μm.

