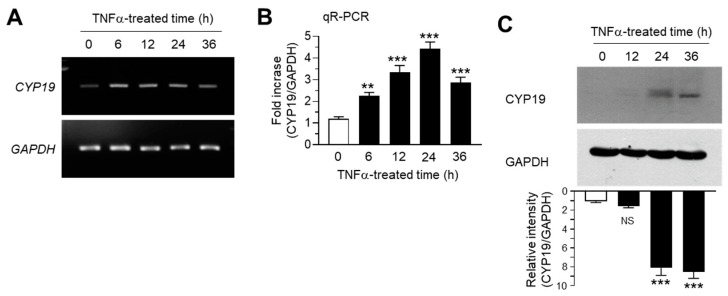
Figure 1.
Effect of tumor necrosis factor alpha (TNFα) on cytochrome P450 19 gene (CYP19) expression. MCF-7 cells were treated with 10 ng/mL TNFα for various durations (0–36 h). (A,B) CYP19 mRNA levels were determined using RT-PCR (A) and qR-PCR (B). Glyceraldehyde 3-phosphate dehydrogenase (GAPDH) mRNA levels were used as an internal control. (C) CYP19 aromatase levels were determined by immunoblot analysis. GAPDH levels were used as internal control. Band intensities were measured using the ImageJ software. Bars represent the mean ± SD (n = 3). NS, not significant, ** p < 0.01, *** p < 0.001 versus control (time 0) by Dunnett’s multiple comparisons test. qR-PCR, quantitative real-time PCR.

