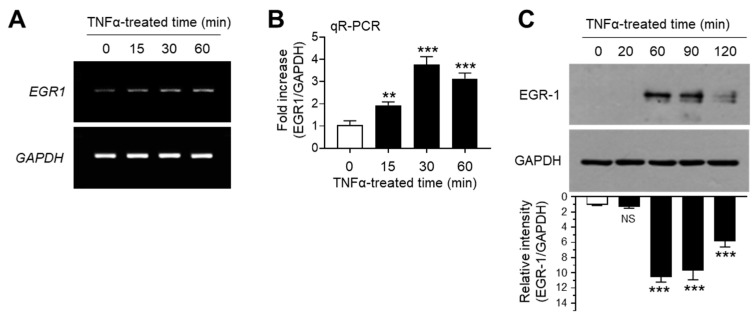
Figure 2.
Effect of TNFα on early growth response gene 1 (EGR-1) expression. MCF-7 cells were treated with 10 ng/mL TNFα for various durations (0–60 min). (A,B) EGR1 mRNA levels were determined by RT-PCR (A) and qR-PCR (B). GAPDH mRNA levels were used as an internal control. (C) EGR-1 levels were measured by immunoblot analysis. GAPDH levels were used as an internal control. Band intensities were measured using the ImageJ software. Bars represent the mean ± SD (n = 3). ** p < 0.01, *** p < 0.001 by Dunnett’s multiple comparisons test. NS, not significant; qR-PCR, quantitative real-time PCR.

