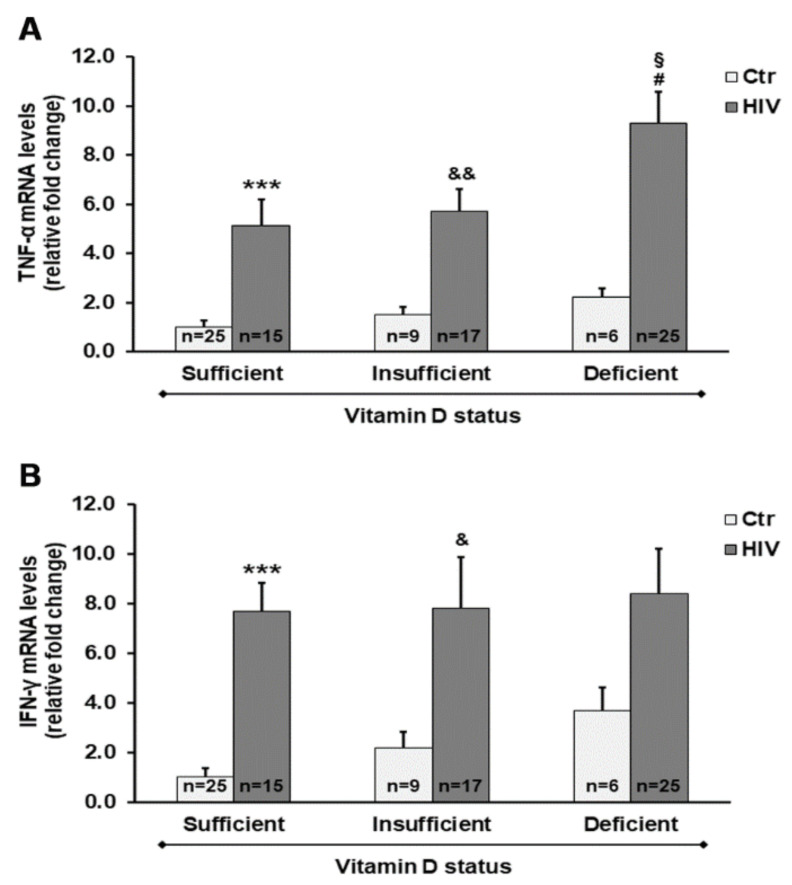
Figure 3.
Gene expression of both tumor necrosis factor-α (TNF-α) (A) and interferon-γ (IFN-γ) (B) in PBMC from HIV+ and healthy subjects. mRNA transcript levels were evaluated by real-time PCR. The results are expressed as mean ± SEM. *** p < 0.001 significant differences in comparison to healthy subjects with sufficient 25(OH)D3 levels; & p < 0.05 and && p < 0.01 significant differences in comparison to healthy subjects with insufficient 25(OH)D3 levels; # p < 0.05 significant differences in comparison to healthy subjects with deficient 25(OH)D3 levels; § p < 0.05 significant difference in comparison to HIV+ subjects with sufficient 25(OH)D3 levels.

