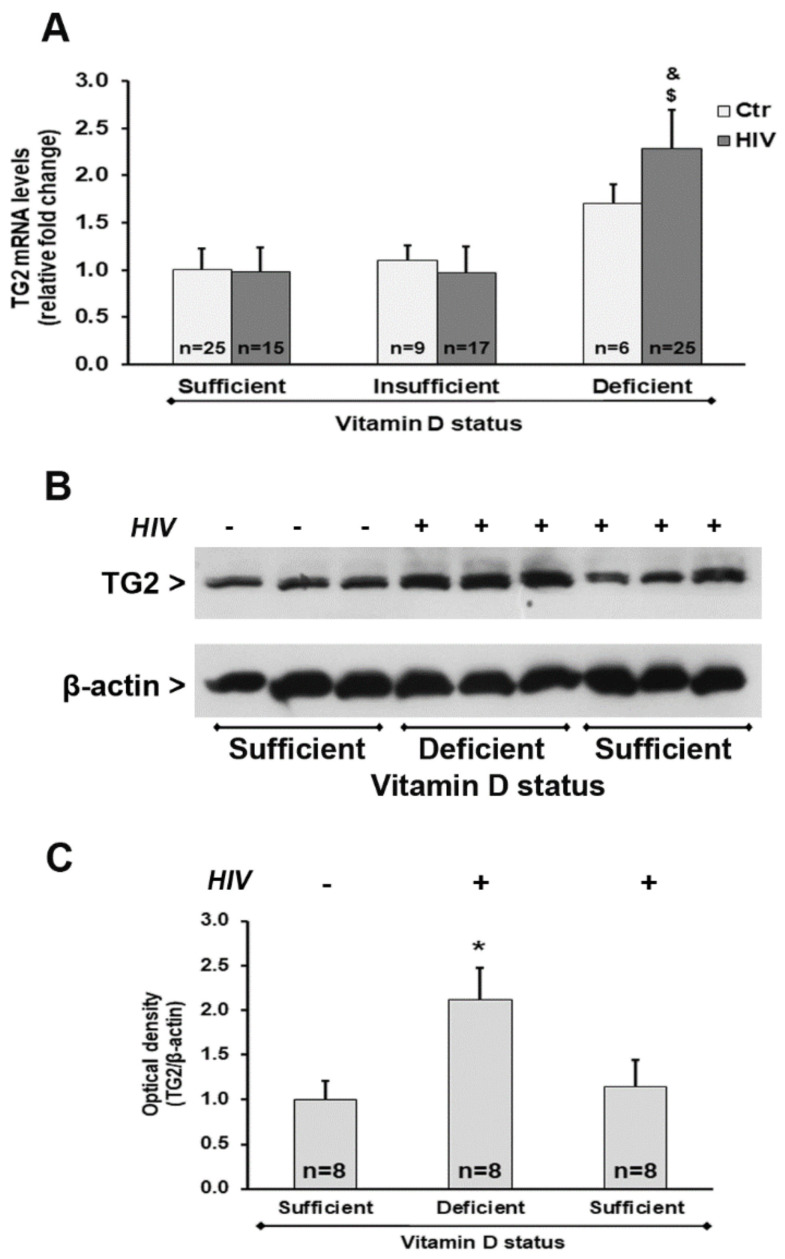
Figure 5.
Tissue transglutaminase (TG2) expression in PBMC from HIV+ and healthy subjects. (A) mRNA transcript levels were evaluated by real-time PCR. The results are expressed as mean ± SEM. (B) Western blot analysis of TG2. (C) Densitometric analysis of immunoblots. The results are representative of the values (mean ± SEM) obtained from eight subjects for each group. * p < 0.05 significant difference in comparison to healthy subjects with sufficient 25(OH)D3 levels; $ p < 0.05 significant difference in comparison to HIV+ subjects with sufficient 25(OH)D3 levels; & p < 0.05 significant difference in comparison to HIV+ subjects with insufficient 25(OH)D3 levels.

