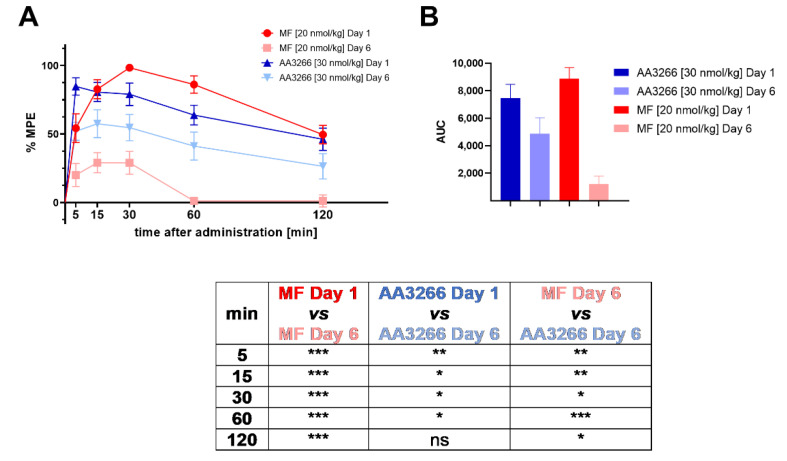
Figure 3.
(A) Time and dose-dependence of antinociceptive effect (i.t. administration, tail-flick test) of AA3266 (30 nmol/kg) compared to morphine (20 nmol/kg) on Day 1 and on Day 6 after prolonged administration. The results for the negative control (NaCl) were no different than zero in all the time points and so they are omitted from the plot for clarity. Thin bars show standard error of the mean. The results of statistical testing are given in a tabular form below the plots. The asterisks denote statistical significance of the difference between the compared values (* p ≤ 0.05, ** p ≤ 0.01, *** p ≤ 0.001, ns—not significant). The statistical analysis used is the Fisher’s Least Significant Difference test (planned comparisons; not corrected for multiple comparisons) at significance level α = 0.05. (B) Area under the antinociceptive response curve (prolonged administration).

